Seeking Range Bar Counter

LetsEat

New member
VIP
Hi Forum,

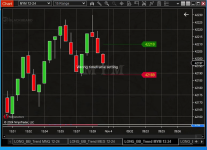
Seeking a Range Bar Counter (Open and Close displayed on my charts)

I prefer trading using Range Bars but have been unable to find a "Range Bar Counter", an indicator that will draw the Upper range bound and the Lower range bound of price-based range bars on my ThinkorSwim charts. I have attached a screenshot to this posting to illustrate the boundary open and close lines being drawn for each Range bar. Unfortunately, this is developed for Ninjatrader by a company called Ninza.

I was hoping there might exist a similar Range Bar Counter in our library hat I might utilize on my ThinkorSwim charts ( Tradingview as an alternate would be better that nothing. Or if someone could help me with the logic and script creation. My sincere thanks to the community in advance.


Best Regards,

William

I shared the indicator on a Ninjatrader chart because it is the only platform that I have seen it used on. I am trading with ThinkorSwim and use Range charts on my charts in TOS given Range Candle Bars as an option for ThinkorSwim. You can choose the Range sizes that you wish to trade with and be displayed such as 4R, 10R, 24R, 120, etc. When selecting your next chart timeframe, you will see the feature to select. The indicator design would need to use the Range sizes choose and calculate it travel distance from its Open to it Close in both direction and display that marker on my charts. I am hoping someone in the Forum has made such a request before and such an indicator exist or others might help code one. Thanks, Billy
 

Attachments

  • Screenshot 2024-11-04 at 11.30.46.png
    Screenshot 2024-11-04 at 11.30.46.png
    372.5 KB · Views: 36
Solution
Hi Forum,

Seeking a Range Bar Counter (Open and Close displayed on my charts)

I prefer trading using Range Bars but have been unable to find a "Range Bar Counter", an indicator that will draw the Upper range bound and the Lower range bound of price-based range bars on my ThinkorSwim charts. I have attached a screenshot to this posting to illustrate the boundary open and close lines being drawn for each Range bar. Unfortunately, this is developed for Ninjatrader by a company called Ninza.

I was hoping there might exist a similar Range Bar Counter in our library hat I might utilize on my ThinkorSwim charts ( Tradingview as an alternate would be better that nothing. Or if someone could help me with the logic and script...
@LetsEat Here is an example of a 2D 120t (trade) chart... The 119 number in the lower right is the remaining tick count for the current candle... Is that what you are looking for, or the high and low price lines in your example above...??? If the latter is the case then we need to know what code is making those within NinjaTrader so it can be replicated in TOS... Those numbers are not for the current candle so we need to know how they are being calculated, such as by the previous x candles...

1730751708606.png


Here is the link to the chart posted above: http://tos.mx/!0Fb9J8lr

I run this as a 5m Chart, but it works well with various Timeframes and Candle/Bar types...
 

Join useThinkScript to post your question to a community of 21,000+ developers and traders.

Hi Forum,

Seeking a Range Bar Counter (Open and Close displayed on my charts)

I prefer trading using Range Bars but have been unable to find a "Range Bar Counter", an indicator that will draw the Upper range bound and the Lower range bound of price-based range bars on my ThinkorSwim charts. I have attached a screenshot to this posting to illustrate the boundary open and close lines being drawn for each Range bar. Unfortunately, this is developed for Ninjatrader by a company called Ninza.

I was hoping there might exist a similar Range Bar Counter in our library hat I might utilize on my ThinkorSwim charts ( Tradingview as an alternate would be better that nothing. Or if someone could help me with the logic and script creation. My sincere thanks to the community in advance.


Best Regards,

William

This seems to work on a range chart so far.
It shows the number of ticks remaining to either reach the high of the range or the low of the range in optional bubbles
Code:
#RangeBars_developing_range

input show_previous = no;
input line_weight   = 4;
def ticks = GetAggregationPeriod();
def o = open;
def h = high;
def l = low;
def c = close;
def r = h - l;

def hr = if IsNaN(close) then hr[1] else (l + ticks);
plot xh = if !show_previous and !IsNaN(close) then Double.NaN else hr;

def lr = if IsNaN(close) then lr[1] else (h - ticks);
plot xl = if !show_previous and !IsNaN(close) then Double.NaN else lr;

def cr = if isnan(close) then cr[1] else close;
plot xc  = if !show_previous and !isnan(close) then double.nan else cr;

input showbubble  = yes;
input bubblemover = 3;
def mover = showbubble and IsNaN(close[bubblemover]) and !IsNaN(close[bubblemover + 1]);
AddChartBubble(mover , hr[bubblemover] , (if tickvalue()==.01 then 100 else 1) * (hr[bubblemover+1] - c[bubblemover+1])+"  Ticks Left", color.white );
AddChartBubble(mover , lr[bubblemover], (if tickvalue()==.01 then 100 else 1) * (c[bubblemover+1] - lr[bubblemover+1])+"  Ticks Left", color.white );

xh.setpaintingStrategy(paintingStrategy.DASHES);
xl.setpaintingStrategy(paintingStrategy.DASHES);
xc.setpaintingStrategy(paintingStrategy.DASHES);

defineglobalColor("H", color.green);
defineglobalColor("L", color.red);
defineglobalColor("C", color.white);

xh.setdefaultColor(globalColor("H"));
xl.setdefaultColor(globalColor("L"));
xc.setdefaultColor(globalColor("C"));

xh.setlineWeight(line_weight);
xl.setlineWeight(line_weight);
xc.setlineWeight(line_weight);

#
 
Last edited:
Solution

Similar threads

Not the exact question you're looking for?

Start a new thread and receive assistance from our community.

87k+ Posts
512 Online
Create Post

Similar threads

Similar threads

The Market Trading Game Changer

Join 2,500+ subscribers inside the useThinkScript VIP Membership Club
  • Exclusive indicators
  • Proven strategies & setups
  • Private Discord community
  • ‘Buy The Dip’ signal alerts
  • Exclusive members-only content
  • Add-ons and resources
  • 1 full year of unlimited support

Frequently Asked Questions

What is useThinkScript?

useThinkScript is the #1 community of stock market investors using indicators and other tools to power their trading strategies. Traders of all skill levels use our forums to learn about scripting and indicators, help each other, and discover new ways to gain an edge in the markets.

How do I get started?

We get it. Our forum can be intimidating, if not overwhelming. With thousands of topics, tens of thousands of posts, our community has created an incredibly deep knowledge base for stock traders. No one can ever exhaust every resource provided on our site.

If you are new, or just looking for guidance, here are some helpful links to get you started.

What are the benefits of VIP Membership?
VIP members get exclusive access to these proven and tested premium indicators: Buy the Dip, Advanced Market Moves 2.0, Take Profit, and Volatility Trading Range. In addition, VIP members get access to over 50 VIP-only custom indicators, add-ons, and strategies, private VIP-only forums, private Discord channel to discuss trades and strategies in real-time, customer support, trade alerts, and much more. Learn all about VIP membership here.
How can I access the premium indicators?
To access the premium indicators, which are plug and play ready, sign up for VIP membership here.
Back
Top