
hi
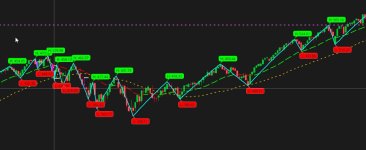
atatch ZIGZAG that work for me fine to see clear the trend ,i need help to :
1) modefy the scirp to show only last 4 boble
2) scan scrip to scan for 2 point higher high and higher low :
atatch ZIGZAG that work for me fine to see clear the trend ,i need help to :
1) modefy the scirp to show only last 4 boble
2) scan scrip to scan for 2 point higher high and higher low :
Code:
input atrLength = 14;
input atrReversal = 2;

# Weekly high, low, and close
def priceH = high(period = AggregationPeriod.WEEK);
def priceL = low(period = AggregationPeriod.WEEK);
def closeW = close(period = AggregationPeriod.WEEK);

# ATR and pivot calculation
def atr = WildersAverage(TrueRange(priceH, closeW, priceL), atrLength);
def hlPivot = atr / closeW * atrReversal;

# State machine logic
def state = {default init, undefined, uptrend, downtrend};
def maxPriceH;
def minPriceL;
def newMax;
def newMin;
def prevMaxH = GetValue(maxPriceH, 1);
def prevMinL = GetValue(minPriceL, 1);

# Initial state
if GetValue(state, 1) == GetValue(state.init, 0) {
    maxPriceH = priceH;
    minPriceL = priceL;
    newMax = yes;
    newMin = yes;
    state = state.undefined;

# Undefined state: check for new high or low
} else if GetValue(state, 1) == GetValue(state.undefined, 0) {
    if priceH >= prevMaxH {
        state = state.uptrend;
        maxPriceH = priceH;
        minPriceL = prevMinL;
        newMax = yes;
        newMin = no;
    } else if priceL <= prevMinL {
        state = state.downtrend;
        maxPriceH = prevMaxH;
        minPriceL = priceL;
        newMax = no;
        newMin = yes;
    } else {
        state = state.undefined;
        maxPriceH = prevMaxH;
        minPriceL = prevMinL;
        newMax = no;
        newMin = no;
    }

# Uptrend state: check for trend reversal or new high
} else if GetValue(state, 1) == GetValue(state.uptrend, 0) {
    if priceL <= prevMaxH - prevMaxH * hlPivot {
        state = state.downtrend;
        maxPriceH = prevMaxH;
        minPriceL = priceL;
        newMax = no;
        newMin = yes;
    } else {
        state = state.uptrend;
        if (priceH >= prevMaxH) {
            maxPriceH = priceH;
            newMax = yes;
        } else {
            maxPriceH = prevMaxH;
            newMax = no;
        }
        minPriceL = prevMinL;
        newMin = no;
    }

# Downtrend state: check for trend reversal or new low
} else {
    if priceH >= prevMinL + prevMinL * hlPivot {
        state = state.uptrend;
        maxPriceH = priceH;
        minPriceL = prevMinL;
        newMax = yes;
        newMin = no;
    } else {
        state = state.downtrend;
        maxPriceH = prevMaxH;
        newMax = no;
        if (priceL <= prevMinL) {
            minPriceL = priceL;
            newMin = yes;
        } else {
            minPriceL = prevMinL;
            newMin = no;
        }
    }
}

# Bar tracking and zigzag logic
def bn = BarNumber();
def barCount = HighestAll(If(IsNaN(priceH), 0, bn));
def newState = GetValue(state, 0) != GetValue(state, 1);
def offset = barCount - bn + 1;

# Identify current high or low pivot points
def highPoint = state == state.uptrend and priceH == maxPriceH;
def lowPoint = state == state.downtrend and priceL == minPriceL;

# Calculate last valid high/low using fold
def lastH;
if highPoint and offset > 1 {
    lastH = fold iH = 1 to offset with tH = priceH while !IsNaN(tH) and !GetValue(newState, -iH)
            do if GetValue(newMax, -iH) or iH == offset - 1 and GetValue(priceH, -iH) == tH
               then Double.NaN else tH;
} else {
    lastH = Double.NaN;
}

def lastL;
if lowPoint and offset > 1 {
    lastL = fold iL = 1 to offset with tL = priceL while !IsNaN(tL) and !GetValue(newState, -iL)
            do if GetValue(newMin, -iL) or iL == offset - 1 and GetValue(priceL, -iL) == tL
               then Double.NaN else tL;
} else {
    lastL = Double.NaN;
}

# Plot ZigZag line
plot ZZ;
if bn == 1 {
    ZZ = fold iF = 1 to offset with tP = Double.NaN while IsNaN(tP)
         do if GetValue(state, -iF) == GetValue(state.uptrend, 0) then priceL
            else if GetValue(state, -iF) == GetValue(state.downtrend, 0) then priceH
            else Double.NaN;
} else if bn == barCount {
    ZZ = if highPoint or state == state.downtrend and priceL > minPriceL then priceH
         else if lowPoint or state == state.uptrend and priceH < maxPriceH then priceL
         else Double.NaN;
} else {
    ZZ = if !IsNaN(lastH) then lastH else if !IsNaN(lastL) then lastL else Double.NaN;
}
ZZ.SetDefaultColor(GetColor(1));
ZZ.SetLineWeight(2);
ZZ.EnableApproximation();

# Detect confirmed zigzag highs/lows
def isHigh = !IsNaN(ZZ) and ZZ == priceH;
def isLow  = !IsNaN(ZZ) and ZZ == priceL;

# Track the last two unique high and low bars
def lastHighBar1 = if isHigh then bn else lastHighBar1[1];
def lastHighBar2 = if isHigh and bn != lastHighBar1[1] then lastHighBar1[1] else lastHighBar2[1];
def lastLowBar1  = if isLow then bn else lastLowBar1[1];
def lastLowBar2  = if isLow and bn != lastLowBar1[1] then lastLowBar1[1] else lastLowBar2[1];

# Show chart bubbles only on the 2 most recent highs/lows
AddChartBubble(bn == lastHighBar1, priceH, "H: " + priceH, Color.GREEN, yes);
AddChartBubble(bn == lastHighBar2, priceH, "H: " + priceH, Color.DARK_GREEN, yes);

AddChartBubble(bn == lastLowBar1, priceL, "L: " + priceL, Color.RED, no);
AddChartBubble(bn == lastLowBar2, priceL, "L: " + priceL, Color.DARK_RED, no);
Attachments
Last edited by a moderator: