#big_four_02_lower
#https://usethinkscript.com/threads/scan-for-vertical-line-buy-and-sell-from-big-four-indicator-script.21150/
#Scan for Vertical Line Buy and Sell from Big Four Indicator Script?
#TechGuy 6/13
#The Big Four Indicator has lots of followers over the two period starting in 2023. Here is one of the first posts.
# https://usethinkscript.com/threads/the-big-four-chart-setup-for-thinkorswim.14711/
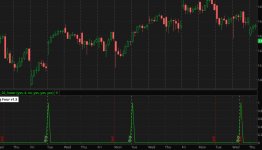
#Unfortunately , one cannot post any replies to these posts. The Buy/Sell Vertical lines look really great on my charts. My question is...is it possible to scan for these Buy/Sell Vertical lines? Many thanks to anyone who may have an idea. I am sure there are many who would like to know the answer.
#----------------------------
#https://usethinkscript.com/threads/the-big-four-chart-setup-for-thinkorswim.14711/
#Indicator Forums Strategies & Chart Setups
#The Big Four Chart SetUp For ThinkOrSwim
#TradingNumbers Jan 6, 2023
#1
#Newest Version v1.5
#Here is the latest update. Also added labels.
# The Big Four Indicator
# https://usethinkscript.com/threads/the-big-four-chart-setup.14711/
# v1.0 - GiantBull and TradingNumbers
# v1.1 - TradingNumbers - hiding vertical lines by ddefault and added arrows
# v1.2 - TradingNumbers - added TMO
# v1.3 - TradingNumbers - hold trend input added
# v1.4 - TradingNumbers - simplified options, added filter with TMO, and set conditions per GianBull parameters
# v1.5 - TradingNumbers - removed TMO color filter percentChg GiantBull, added labels
# Info Labels
declare lower;
#input showLabels = yes;
#AddLabel(showLabels, " The Big Four v1.5 ", Color.WHITE);
# AK Trend
def aktrend_input1 = 3;
def aktrend_input2 = 8;
def aktrend_price = close;
def aktrend_fastmaa = MovAvgExponential(aktrend_price, aktrend_input1);
def aktrend_fastmab = MovAvgExponential(aktrend_price, aktrend_input2);
def aktrend_bspread = (aktrend_fastmaa - aktrend_fastmab) * 1.001;
def cond1_UP = if aktrend_bspread > 0 then 1 else 0;
def cond1_DN = if aktrend_bspread <= 0 then -1 else 0;
# ZSCORE
def zscore_price = close;
def zscore_length = 20;
def zscore_ZavgLength = 20;
def zscore_oneSD = StDev(zscore_price, zscore_length);
def zscore_avgClose = SimpleMovingAvg(zscore_price, zscore_length);
def zscore_ofoneSD = zscore_oneSD * zscore_price[1];
def zscore_Zscorevalue = ((zscore_price - zscore_avgClose) / zscore_oneSD);
def zscore_avgZv = Average(zscore_Zscorevalue, 20);
def zscore_Zscore = ((zscore_price - zscore_avgClose) / zscore_oneSD);
def zscore_avgZscore = Average(zscore_Zscorevalue, zscore_ZavgLength);
def cond2_UP = if zscore_Zscore > 0 then 1 else 0;
def cond2_DN = if zscore_Zscore <= 0 then -1 else 0;
# Ehlers
def ehlers_length = 34;
def ehlers_price = (high + low) / 2;
def ehlers_coeff = ehlers_length * ehlers_price * ehlers_price - 2 * ehlers_price * Sum(ehlers_price, ehlers_length)[1] + Sum(ehlers_price * ehlers_price, ehlers_length)[1];
def ehlers_Ehlers = Sum(ehlers_coeff * ehlers_price, ehlers_length) / Sum(ehlers_coeff, ehlers_length);
def cond3_UP = if close > ehlers_Ehlers then 1 else 0;
def cond3_DN = if close <= ehlers_Ehlers then -1 else 0;
# Anchored Momentum
def amom_src = close;
def amom_MomentumPeriod = 10;
def amom_SignalPeriod = 8;
def amom_SmoothMomentum = no;
def amom_SmoothingPeriod = 7;
def amom_p = 2 * amom_MomentumPeriod + 1;
def amom_t_amom = if amom_SmoothMomentum == yes then ExpAverage(amom_src, amom_SmoothingPeriod) else amom_src;
def amom_amom = 100 * ( (amom_t_amom / ( Average(amom_src, amom_p)) - 1));
def amom_amoms = Average(amom_amom, amom_SignalPeriod);
def cond4_UP = if amom_amom > 0 then 1 else 0;
def cond4_DN = if amom_amom <= 0 then -1 else 0;
# TMO
def tmo_length = 30; #def 14
def tmo_calcLength = 6; #def 5
def tmo_smoothLength = 6; #def 3
def tmo_data = fold i = 0 to tmo_length with s do s + (if close > GetValue(open, i) then 1 else if close < GetValue(open, i) then - 1 else 0);
def tmo_EMA5 = ExpAverage(tmo_data, tmo_calcLength);
def tmo_Main = ExpAverage(tmo_EMA5, tmo_smoothLength);
def tmo_Signal = ExpAverage(tmo_Main, tmo_smoothLength);
def tmo_color = if tmo_Main > tmo_Signal then 1 else -1;
def cond5_UP = if tmo_Main <= 0 then 1 else 0;
def cond5_DN = if tmo_Main >= 0 then -1 else 0;
# Strategy
input Strategy_Confirmation_Factor = 4;
input Strategy_FilterWithTMO = no;
input Strategy_ColoredCandlesOn = yes;
input Strategy_VerticalLinesOn = no;
input Strategy_HoldTrend = yes;
def cond_UP = cond1_UP + cond2_UP + cond3_UP + cond4_UP;
def cond_DN = cond1_DN + cond2_DN + cond3_DN + cond4_DN;
def direction = if cond_UP >= Strategy_Confirmation_Factor and (!Strategy_FilterWithTMO or cond5_UP) then 1
else if cond_DN <= -Strategy_Confirmation_Factor and (!Strategy_FilterWithTMO or cond5_DN) then -1
else if !Strategy_HoldTrend and direction[1] == 1 and cond_UP < Strategy_Confirmation_Factor and cond_DN > -Strategy_Confirmation_Factor then 0
else if !Strategy_HoldTrend and direction[1] == -1 and cond_DN > -Strategy_Confirmation_Factor and cond_UP < Strategy_Confirmation_Factor then 0
else direction[1];
def signal_up = direction == 1 and direction[1] < 1;
#plot signal_up = direction == 1 and direction[1] < 1;
#signal_up.SetPaintingStrategy(PaintingStrategy.BOOLEAN_ARROW_UP);
#signal_up.SetDefaultColor(Color.WHITE);
#signal_up.Hide();
#signal_up.HideBubble();
#signal_up.HideTitle();
def signal_dn = direction == -1 and direction[1] > -1;
#plot signal_dn = direction == -1 and direction[1] > -1;
#signal_dn.SetPaintingStrategy(PaintingStrategy.BOOLEAN_ARROW_DOWN);
#signal_dn.SetDefaultColor(Color.WHITE);
#signal_dn.Hide();
#signal_dn.HideBubble();
#signal_dn.HideTitle();
#AssignPriceColor(if Strategy_ColoredCandlesOn then if direction == 1 then Color.LIGHT_GREEN else if direction == -1 then Color.RED else Color.GRAY else Color.CURRENT);
#AddLabel(showLabels, if Strategy_ColoredCandlesOn then if direction == 1 then " Bullish " else if direction == -1 then " Bearish " else " Neutral " else " N/A ", if Strategy_ColoredCandlesOn then if direction == 1 then Color.LIGHT_GREEN else if direction == -1 then Color.RED else Color.GRAY else Color.BLACK);
#Alert(signal_up[1], "Buy", Alert.BAR, Sound.DING);
#Alert(signal_dn[1], "Sell", Alert.BAR, Sound.DING);
#--------- buy sell signals
# enable one of these plots and disable the other , with a #
plot zup = signal_up;
zup.setdefaultcolor(color.green);
#plot zdwn = signal_dn;
#zdwn.setdefaultcolor(color.red);
#AddVerticalLine(Strategy_VerticalLinesOn and signal_up, "Buy", Color.LIGHT_GREEN);
#AddVerticalLine(Strategy_VerticalLinesOn and signal_dn, "Sell", Color.RED);
#

 Like
Like