Happy Holidays!
I have been a very active user of these extremely valuable resources that you guys have created, and appreciate it very much!
I would like to scan for stocks based on these parameters.
For example:
show me stocks (on Monday) whose implied (weekly) move is greater than $1, $3, $5, etc
or show me stocks whose implied move is greater than 10%
and or filter by only displaying those whose implied volatility is greater than 100% and has a daily option volume of 10,000
I would be very grateful if someone can make for me the "Full Package" whatever studies, indicators, custom scripts are needed to create the output - ideally a user friendly watchlist which can be sorted by the critical inputs
Please let me know if any more information is needed.
Thanks in advance and have a wonderful holiday season!!


Forgive me but in my limited understanding this doesn't sound correct.
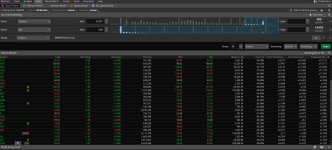
I have already gotten this far on my own - see screenshot below (last four columns of results) where I can scan and sort based on expected move.
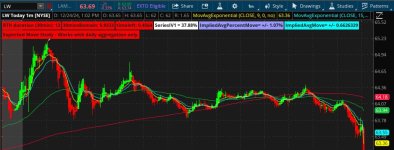
Also I have a study installed which shows me the implied percent move (second screenshot white and purple labels on top)
I think using these two combined there should be a way to do it.
Maybe someone else can help?
Here are the two scripts
EMWATCH:
Here is the script for the implied daily move
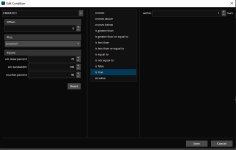
To be honest I don't even know how to use the EMWATCH script - I just set it to show me ones that are "True" (see screenshot
My goal is to find stocks with a HIGH weekly and/or daily implied/expected move.
High can either be percentage based (above 10%) or dollar amount (above $5),
It would also be helpful to be able to show (sort or filter) by the options volume - but if this is not possible I can work without it.
I also have this script but I have no idea what to do with it or how to utilize it:
It is from this thread where they say there is a scanner:
https://usethinkscript.com/threads/implied-move-based-on-weekly-options-for-thinkorswim.1449
Either way thanks a lot for your support!!
I have been a very active user of these extremely valuable resources that you guys have created, and appreciate it very much!
I would like to scan for stocks based on these parameters.
For example:
show me stocks (on Monday) whose implied (weekly) move is greater than $1, $3, $5, etc
or show me stocks whose implied move is greater than 10%
and or filter by only displaying those whose implied volatility is greater than 100% and has a daily option volume of 10,000
I would be very grateful if someone can make for me the "Full Package" whatever studies, indicators, custom scripts are needed to create the output - ideally a user friendly watchlist which can be sorted by the critical inputs
Please let me know if any more information is needed.
Thanks in advance and have a wonderful holiday season!!
Forgive me but in my limited understanding this doesn't sound correct.
I have already gotten this far on my own - see screenshot below (last four columns of results) where I can scan and sort based on expected move.
Also I have a study installed which shows me the implied percent move (second screenshot white and purple labels on top)
I think using these two combined there should be a way to do it.
Maybe someone else can help?
Here are the two scripts
EMWATCH:
Code:
# EMswitch Weely_Expected_Move
####################################
# TheoTrade_Weely_Expected_Move
def agg = GetAggregationPeriod();
input em_skew_percent = 70;
input em_bandwidth = 100;
input touches_percent = 90;
#
# routine to force looking for the highest bar number
#
def barcount = BarNumber();
def lastbar = HighestAll(if IsNaN(high) then 0 else barcount);
def ivGapHi;
def expmove;
def high_bar;
def low_bar;
def em_close;
def weekcnt;
def touch_high_bar;
def touch_low_bar;
############ logic to check for holidays #########
# Change EM calculation on Monday (Day #1) or when last trading day
# was a Friday (Day #5) and the current day is Tuesday (Day #2).
#
# Continue assumption that EM is being calculated on a Saturday. 6 days
# to expire.
############
if GetDayOfWeek(GetYYYYMMDD()) == 1 or (getdayofweek(getYYYYMMDD()[1]) == 5 and getdayofweek(getyyyymmdd()) == 2)
then {
ivGapHi = imp_volatility()[1];
expmove = close[1] * ivGapHi * Sqrt(6) / Sqrt(365) * em_skew_percent / 100 * em_bandwidth / 100;
high_bar = close[1] + expmove;
touch_high_bar = close[1] + (expmove * touches_percent/100);
low_bar = close[1] - expmove;
touch_low_bar = close[1] - (expmove * touches_percent/100);
em_close = close[1];
weekcnt=weekcnt[1] + 1;
}
else {
ivGapHi = ivGapHi[1];
expmove = expmove[1];
high_bar = high_bar[1];
touch_high_bar = touch_high_bar[1];
low_bar = low_bar[1];
touch_low_bar= touch_low_bar[1];
em_close = em_close[1];
weekcnt = weekcnt[1];
}
def peak = if high_bar > 1 and Close > high_bar then 1 else 0;
def valley = if low_bar > 1 and Close < low_bar then 1 else 0;
def touchpeak = if high_bar > 1 and ((High >= touch_high_bar and High >= touch_high_bar) or (Close < high_bar and close >= touch_high_bar)) then 1 else 0;
def touchvalley = if low_bar > 1 and ((Low <= touch_low_bar and Low <= touch_low_bar) or (Close > low_bar and Close <= touch_low_bar)) then 1 else 0;
def pkcnt =  if  peak then pkcnt[1] + 1 else pkcnt[1] ;
def vcnt = if valley then vcnt[1] + 1 else vcnt[1] ;
def peakcnt = if weekcnt != weekcnt[1] or valley then 0 else  if  peak then peakcnt[1] + 1 else peakcnt[1] ;
def valleycnt = if weekcnt != weekcnt[1] or peak then 0 else if valley then valleycnt[1] + 1 else valleycnt[1] ;
def touchpeakcnt = if weekcnt != weekcnt[1] or touchvalley   then 0 else if touchpeak then touchpeakcnt[1] + 1 else touchpeakcnt[1] ;
def touchvalleynt = if weekcnt != weekcnt[1] or touchpeak  then 0 else if touchvalley then touchvalleynt[1] + 1 else touchvalleynt[1] ;
#plot Data = expmove;
def Dailydirection = if    (valley or touchvalley) then 1 else if ( peak or touchpeak) then -1 else if IsNaN(Dailydirection[1]) then 0 else Dailydirection[1];
plot emswitch  = Dailydirection <> Dailydirection[1];
Here is the script for the implied daily move
Code:
#Implied Average Daily Move% Formula ~ IV%*sqrt(1/365)*sqrt(2/pi)

#Per @SqueezeMetrics

#"Implied volatility is quoted as an annualized standard deviation. So, e.g., "40% IV" theoretically* means that there's a ~68% chance that the underlying ends within ±40% of where it is now after 365 calendar days.
#*an unwarranted extrapolation
#For the small audience of volatility enthusiasts *without* masochistic tendencies, consider this: The use of annualization and standard deviation are arbitrary and stupid.
#Why? Because options are priced using mean outcomes (like everything), and hedge-replication is done daily.
#So to translate 40% IV to "implied average daily move," do this:
#40% * √(1/365) * √(2/π) = 1.67%
#"±1.67% average daily move."
#Much less stupid."


#I, @CommercialGary, much more stupid than Squeeze, made this for use WITH 0DTE

#USING THE "TIMELEFT" VARIABLE BELOW MEANS IT WILL ONLY WORKS ON INTRADAY(IE LESS THAN A DAY) TIMEFRAMES AND ONLY DURING REGULAR TRADING HOURS, IF WANTING TO USE DURING AFTER/PREMARKET JUST CHANGE "TIMELEFT" TO DTE WHICH IS ALREADY INPUT AT 1 OR JUST REPLACE WITH 1. THATLL BE THE IMPLIED AVG DAILY MOVE. OR  U  CAN ADD AN IF ELSE STATEMENT TO TIMELEFT SO IT AUTO REVERTS TO 1 OUTSIDE REG TRADING HOURS.

#GOODLUCK.


input Series_IV = 1;  #term series, 1 is front most.
input DTE = 1; #days to expiry, replace timeleft if you want to know avg given #days to expiry instead of time remaining


def rth = 2*(RegularTradingEnd(GetYYYYMMDD()) - RegularTradingStart(GetYYYYMMDD())) / AggregationPeriod.HOUR;
AddLabel(yes, "RTH duration (30min): " + rth);

input CloseTime = 1600;

def thirtyminRemained = 2*SecondsTillTime(CloseTime) /3600;
AddLabel(1, "30minsRemain: " + thirtyminRemained);
def timeleft = thirtyminRemained / rth;
AddLabel(1, "timeleft: " + timeleft);


def pi = Double.Pi;

def IV1 = SeriesVolatility(series = Series_IV); #gives the tos' option chain series IV, particularly the front most expiration.

AddLabel(1, "SeriesIV1 = " + AsPercent(IV1
), Color.WHITE); #make sure it matches the IV on chain just in case

def ImpAvgDailyMove = IV1 * Sqrt( timeleft / 365) * Sqrt(2 / pi);

def dm = ImpAvgDailyMove * close; #gives impl daily move in $ instead of %

AddLabel(1, "ImpliedAvgPercentMove= +/- " + AsPercent(ImpAvgDailyMove), Color.VIOLET);
AddLabel(1, "ImpliedAvgMove= +/- " + AsPrice(dm), Color.CYAN);


#WONT SHOW UP ON DAILY TIMEFRAMES OR HIGHER. IF YOU JUST WANT DAILY IMPLIED MOVE REPLACE
#TIMELEFT WITH 1.
#On an intraday chart it calcs the avg implied move given remaining time to expiration.
To be honest I don't even know how to use the EMWATCH script - I just set it to show me ones that are "True" (see screenshot
My goal is to find stocks with a HIGH weekly and/or daily implied/expected move.
High can either be percentage based (above 10%) or dollar amount (above $5),
It would also be helpful to be able to show (sort or filter) by the options volume - but if this is not possible I can work without it.
I also have this script but I have no idea what to do with it or how to utilize it:
It is from this thread where they say there is a scanner:
https://usethinkscript.com/threads/implied-move-based-on-weekly-options-for-thinkorswim.1449
Code:
# Mobius_
# Implied Move For Various Times based on the Series IV
# Mobius
# V01.03.2017

input show_label = yes;
input nDays = 4; #hint nDays: Days left in series.
input Series_IV = 1; #hint Series_IV: Series 1 is closest expirery.
input defClose = {default "Friday"};
input ShowLabels = yes;
input show252day = no;
input show365day = no;
input show1day = yes;
input Label_Color_Choice = {default "pink", "cyan", "orange", "gray", "yellow", "red", "green", "dark_gray", "light_yellow", "white"};

def CurrentDOW = GetDayOfWeek(GetYYYYMMDD());
def cbar = if CurrentDOW == 5
           then BarNumber()
           else cbar[1];
def c = if BarNumber() == cbar
        then close(period = AggregationPeriod.DAY)
        else c[1];
def t;
switch (defClose) {

case Friday:
    t = if BarNumber() == cbar
        then close(period = AggregationPeriod.DAY)
        else c[1];
}
def IV = if IsNaN(imp_volatility(period = AggregationPeriod.DAY))
         then IV[1]
         else imp_volatility(period = AggregationPeriod.DAY);
def seriesIV = SeriesVolatility(series = Series_IV);
def ImpMove = (((t * seriesIV * Sqrt(nDays)) / Sqrt(365)) / TickSize()) * TickSize();
def ImpMove252 = (((t * seriesIV * Sqrt(nDays)) / Sqrt(252)) / TickSize()) * TickSize();
def ImpMove365 = (((t * seriesIV * Sqrt(nDays)) / Sqrt(365)) / TickSize()) * TickSize();
def ImpMove1 = Round(((t * seriesIV * Sqrt(1)) / Sqrt(365)) / TickSize(), 0) * TickSize();
def LastBar= if !IsNaN(close) and IsNaN(close[-1])
             then barnumber()
             else Double.NaN;
def upline = if !IsNaN(close) and IsNaN(close[-1])
             then t + ImpMove
             else if IsNaN(close)
                  then upline[1]
                  else Double.NaN;
def upper = if BarNumber() >= HighestAll(lastBar) and
                 BarNumber() <= HighestAll(lastBar) + nDays
              then upline
              else Double.NaN;


def lowline = if !IsNaN(close) and IsNaN(close[-1])
              then t - ImpMove
              else if IsNaN(close)
                   then lowline[1]
                   else Double.NaN;
def lower = if BarNumber() >= HighestAll(lastBar) and
                 BarNumber() <= HighestAll(lastBar) + nDays
              then lowline
              else Double.NaN;


def emu = close > upper;
def emub = high > upper and close < upper;
def emd = close < lower;
def emdb = low < lower and close > lower;
plot scan = emu or emub or emd or emdb;

# End Code Implied Moves From Series IV

AssignBackgroundColor(
if scan and
emu then Color.lime else
if emd then color.light_red else
if emdb then color.dark_red else
if emub then color.dark_green else color.black);

 addlabel(yes,

if emu then "Abv" else
if emd then "Blw" else
if emub then "RDn" else
if emdb then "RUp" else "In");
Either way thanks a lot for your support!!
Attachments
Last edited:


