Hi All,
I just joined recently, and have been browsing the indicator forums. I found one that I'd like to explore more. The code is in this post. I'd like to get a scanner for it made.
https://usethinkscript.com/threads/sar-macd-for-thinkorswim.15409/
Is this the right forum to ask this question in?
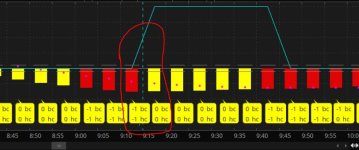
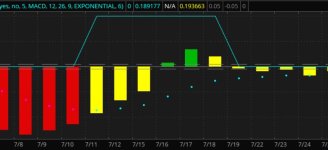
So I'm looking to be able to scan a watch list say S&P500 stocks for stocks where the red colored bar has turned yellow within a certain number of bars, which would be choose able. For time frames, I'm thinking, 1hr, 2hr,4hr,1D. I have drawn arrows on the chart picture below, so show what I'm referring to.
Thanks for taking a look at this!
here is what i did,
you want something based on the histogram colors, so determine what causes them.
this is the histogram and code to change its colors.
macd.SetPaintingStrategy(PaintingStrategy.HISTOGRAM);
macd.AssignValueColor(if macdSel then
if bc>0 then CreateColor(1, 185, 7) else
if bc<0 then CreateColor(224, 4, 4) else Color.YELLOW else
if hc>0 then CreateColor(1, 185, 7) else
if hc<0 then CreateColor(224, 4, 4) else Color.YELLOW);
so bc and hc determine the colors. i could stare at the code and figure out the logic, but the if-thens are a little starnge, and it's easier to just draw a bubble with values, to see what is going on.
addchartbubble(1, -0.5,
bc + " bc\n" +
hc + " hc"
, color.yellow, no);
you want a red to yellow transition, so,
when the hisogram is red, bc and hc are -1.
when yellow, they are both 0.
so we need to find when they are = 0 and on the previous bar they were -1.
i could add another bubble, but a verticalline also works. this draws a vertical line just before the first yellow bar, right where you want.
addverticalline(
(bc[1] == -1 and hc[1] == -1 and bc[0] == 0 and hc[0] == 0),
"-",
color.cyan);
the next thing to do is count the bars from that signal and compare the count to some number.
you want a scan study to have 1 plot and for it to be true for the desired situation.
plot z will be true on the signal and for the 5 bars after it.
for a scan or column, you will have to edit the code to change an input number.
def cnt = if (bc[1] == -1 and hc[1] == -1 and bc[0] == 0 and hc[0] == 0) then 1 else cnt[1] + 1;
# scan for signals less than x bars ago
input max_cnt = 6;
plot z = cnt <= max_cnt;
there should be a pulsed line plot on the histogram, a line that goes to 1 on the first yellow bar and stays at 1 for the next 5 bars.
once we get to this point and verify the plot formula, we can remove all the code after it. scans need just 1 plot, no labels, no other plots, no bubbles, no clouds.
watchlist study/scan
sarmacd
http://tos.mx/!HJFiGHME
5 minute time
Code:
# sarmacd
# SAR_MACD_Scan_scan_01

#https://usethinkscript.com/threads/sar-macd-scan.19909/
#SAR MACD Scan

# https://usethinkscript.com/threads/sar-macd-for-thinkorswim.15409/
# to scan a watch list for stocks where the red colored bar has turned yellow within a certain number of bars

# ----------------------------

#https://usethinkscript.com/threads/sar-macd-for-thinkorswim.15409/
#Indicators Custom
#SAR MACD for ThinkOrSwim
#samer800  May 6, 2023

#Buy Condition:
#MA Color - Blue
#Histogram- Above Zero
#Histogram/Candle -Green
#MA Crossover is must
#Sell Condition:
#MA Color - Red
#Histogram- Below Zero
#Histogram/Candle -Red
#MA Cross under is must

#Warning: Must not be used as a standalone indicator. Use for confirmation of your Buy Sell Signals and Entry only.

#// https://www.tradingview.com/v/uXB6f9Y5/
#// © traderharikrishna
#indicator("SARMACD")
# Converted and mod by Sam4Cok@Samer800    - 05/2023

declare lower;

def na = double.nan;
def bn = barnumber();
input ColorBars = yes;
input ShowSignals = no;
input sideways = 5;#,'sideways')
input GraphType = {default MACD, HIST};    # 'Graph Type'
input fastLength = 12;
input slowLength = 26;
input macdLength = 9;
input averageType = AverageType.EXPONENTIAL;

def pos = Double.POSITIVE_INFINITY;
def neg = Double.NEGATIVE_INFINITY;
def last = isNaN(close);
def macdSel = GraphType==GraphType.MACD;
def HistSel = GraphType==GraphType.HIST;

def sar = ParabolicSAR();
def cross = crosses(close,sar);
def sa = if cross then close else sa[1];
def dir = if sar < close then 1 else -1;

def m = MovingAverage(averageType, close, fastLength) - MovingAverage(averageType, close, slowLength);
def s = MovingAverage(averageType, m, MACDLength);
def h = m - s;

def bc = if dir ==  1 and close > sa and m>0 then  1 else
         if dir == -1 and close < sa and m<0 then -1 else 0;
def hc = if dir ==  1 and close > sa and h>0 then  1 else
         if dir == -1 and close < sa and h<0 then -1 else 0;


def cnt = if (bc[1] == -1 and hc[1] == -1 and bc[0] == 0 and hc[0] == 0) then 1 else cnt[1] + 1;

# scan for signals less than x bars ago
input max_cnt = 6;

plot z = if bn == 1 then 0 else cnt <= max_cnt;

addchartbubble(0, -0.5,
bc + "  bc\n" +
hc + "  hc"
, color.yellow, no);


addverticalline(0 and
 (bc[1] == -1 and hc[1] == -1 and bc[0] == 0 and hc[0] == 0),
 "-",
 color.cyan);
#


