
Author Message:
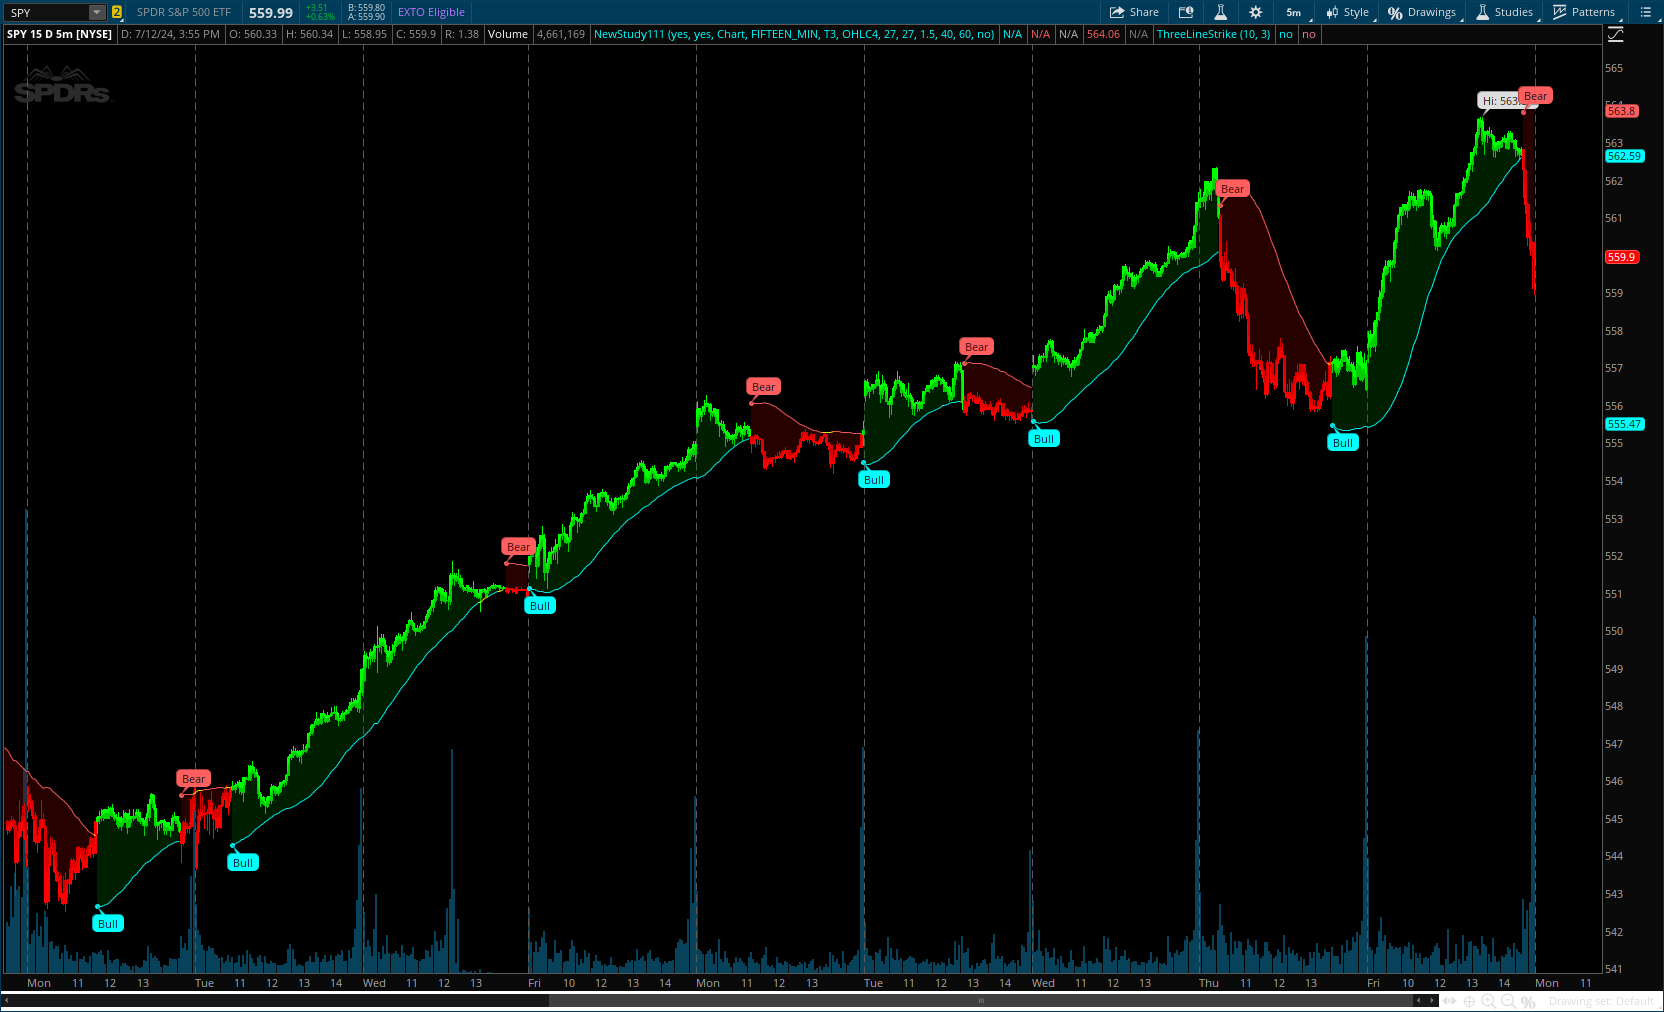
The RSI Trail indicator is a technical analysis tool designed to assist traders in making informed decisions by utilizing the Relative Strength Index (RSI) and various moving average calculations. This indicator dynamically plots support and resistance levels based on RSI values, providing visual cues for potential bullish and bearish signals. The inclusion of a trailing stop mechanism allows traders to adapt to market volatility, ensuring optimal entry and exit points.
Update - Added MACD Trail - 08/2024
Code:
#// Indicator for TOS
#// © UAlgo @fluxchart
# indicator("RSI Trail [UAlgo]", shorttitle="RSI Trail [UAlgo]", overlay=true)
# indicator("MACD Trail | Flux Charts", overlay = true)
# Converted by Sam4Cok@Samer800    - 07/2024
# Updated Added MACD TrailType by Sam4Cok@Samer800 - 08/2024

input trailType = {default "RSI", "MACD", "Avg RSI & MACD"};
input ColorCandles = no; #='Color Candles', inline="display"
input showBubbles = yes;
input timeframe = {default "Chart", "Manual"};
input manualTimeframe = AggregationPeriod.FIFTEEN_MIN;
input MovingAverageType = {"SMA", "EMA", "WMA", "RMA", "HMA", default "T3", "McGinley", "KAMA"}; # "Mov Avg Type"
input MovAvgSrc  = FundamentalType.OHLC4;
input lookbackPeriod = 27;
input atrLength = 27;
input atrMultiplier = 1.5;
input rsiLowerThreshold = 40;   # "RSI Lower Bound"
input rsiUpperThreshold = 60;   # "RSI Upper Bound"
input showMidline = no;         # "Show Midline"

def na = Double.NaN;
def last = IsNaN(close);
def src;
def c;
def h;
def l;
def ohlc;
switch (timeframe) {
case "Manual" :
    src = if !last then Fundamental(FundamentalType = MovAvgSrc, Period = manualTimeframe) else src[1];
    c = if !last then close(Period = manualTimeframe) else c[1];
    h = if !last then high(Period = manualTimeframe) else h[1];
    l = if !last then low(Period = manualTimeframe) else l[1];
    ohlc = if !last then ohlc4(Period = manualTimeframe) else ohlc[1];
default :
    src = Fundamental(FundamentalType = FundamentalType.OHLC4);
    c = close;
    h = high;
    l = low;
    ohlc = ohlc4;
}
script t3 {
    input source = close;
    input length = 21;
    input vf = 0.7;
    def ema1 = ExpAverage(source, length);
    def ema2 = ExpAverage(ema1, length);
    def gd1 = ema1 * (1 + vf) - ema2 * vf;
    def ema11 = ExpAverage(gd1, length);
    def ema22 = ExpAverage(ema11, length);
    def gd2 = ema11 * (1 + vf) - ema22 * vf;
    def ema111 = ExpAverage(gd2, length);
    def ema222 = ExpAverage(ema111, length);
    def gd3 = ema111 * (1 + vf) - ema222 * vf;
    plot out = gd3;
}
script kama {
    input source = close;
    input length = 28;
    def fast = 0.666;
    def slow = 0.064;
    def noisex = AbsValue(source - source[1]);
    def signal = AbsValue(source - source[length]);
    def noise = Sum(noisex, length);
    def ratio = if noise != 0 then signal / noise else 0;
    def smooth = Power(ratio * (fast - slow) + slow, 2);
    def KAMA = CompoundValue(1, KAMA[1] + smooth * (source - KAMA[1]), source);
    plot out = KAMA;
}
#// Function to select Moving Average
script f_get_ma {
    input _type = "EMA";
    input _src = ohlc4;
    input _length = 27;
    def sma = Average(_src, _length);
    def ema = ExpAverage(_src, _length);
    def wma = WMA(_src, _length);
    def rma = WildersAverage(_src, _length);
    def hma = HullMovingAvg(_src, _length);
    def kama = KAMA(_src, _length);
    def t3 = T3(_src, _length);
    def mcg = CompoundValue(1, if !mcg[1] then _src else
              (mcg[1] + (_src - mcg[1]) / (0.6 * _length * Power((_src / mcg[1]), 4))), _src);
    def ma = if _type == "SMA" then sma else
             if _type == "EMA" then ema else
             if _type == "WMA" then wma else
             if _type == "RMA" then rma else
             if _type == "HMA" then hma else
             if _type == "T3" then t3 else
             if _type == "KAMA" then kama else
             if _type == "McGinley" then mcg else ema;
    plot out = ma;
}
#// Calculate indicator values
script f_calculate_bounds {
    input _ma = ohlc4;
    input _range = 1;
    input _upper = 60;
    input _lower = 40;
    def upper_bound = _ma + (_upper - 50) / 10 * _range;
    def lower_bound = _ma - (50 - _lower) / 10 * _range;
    plot upper = upper_bound;
    plot lower = lower_bound;
}
def tr = TrueRange(h, c, l);
def nzTR = if IsNaN(tr) then (h - l) else tr;
def f_volatility = WildersAverage(nzTR, atrLength) * atrMultiplier;
def rsi_base = f_get_ma(MovingAverageType, src, lookbackPeriod);
def rsiUp = f_calculate_bounds(rsi_base, f_volatility, rsiUpperThreshold, rsiLowerThreshold).upper;
def rsiLo = f_calculate_bounds(rsi_base, f_volatility, rsiUpperThreshold, rsiLowerThreshold).lower;

input macdFastLength = 12;
input macdSlowLength = 26;
input macdSignalLength = 9;
input macdMulti = 9.0;#, "MACD Length", group = "General Configuration", display = display.none)
input macdSmoothing = 5;#, "Smoothing", group = "General Configuration", display = display.none)

def fast = Floor(macdMulti * (macdFastLength / macdSignalLength));
def slow = Floor(macdMulti * (macdSlowLength / macdSignalLength));
def fastMovAvg = f_get_ma(MovingAverageType, ohlc, fast);
def slowMovAvg = f_get_ma(MovingAverageType, ohlc, slow);
def macdLine = fastMovAvg - slowMovAvg;
def macdBase = ohlc + macdLine;
def MACDTrailRAWBull = macdBase - f_volatility;
def MACDTrailRAWBear = macdBase + f_volatility;
def macdUp = f_get_ma(MovingAverageType, MACDTrailRAWBear, macdSmoothing);
def macdLo = f_get_ma(MovingAverageType, MACDTrailRAWBull, macdSmoothing);
def macd_Base = f_get_ma(MovingAverageType, macdBase, macdSmoothing);

def f_upper_bound;
def f_lower_bound;
def f_ma_base;
switch (trailType) {
case "MACD" :
    f_ma_base     = if last then na else macd_Base;
    f_upper_bound = if last then na else macdUp;
    f_lower_bound = if last then na else macdLo;
case "Avg RSI & MACD" :
    f_ma_base     = if last then na else (macd_Base + rsi_base) / 2;
    f_upper_bound = if last then na else (macdUp + rsiUp) / 2;
    f_lower_bound = if last then na else (macdLo + rsiLo) / 2;
default :
    f_ma_base     = if last then na else rsi_base;
    f_upper_bound = if last then na else rsiUp;
    f_lower_bound = if last then na else rsiLo;
}
#// Determine market state
def is_bullish;
def is_bearish;
def bull_signal;
def bear_signal;
def crossUp = (ohlc > f_upper_bound) and (ohlc[1] <= f_upper_bound[1]);
def crossDn = (c < f_lower_bound) and (c[1] >= f_lower_bound[1]);
if crossUp {
    bull_signal = !is_bullish[1];
    bear_signal = no;
    is_bullish = yes;
    is_bearish = no;
} else if crossDn {
    bull_signal = no;
    bear_signal = !is_bearish[1];
    is_bullish = no;
    is_bearish = yes;
} else {
    bull_signal = no;
    bear_signal = no;
    is_bullish = is_bullish[1];
    is_bearish = is_bearish[1];
}

def retestUp = if is_bullish[1] then
               if low < f_lower_bound then retestUp[1] + 1 else retestUp[1] else 0;
def retestDn = if is_bearish[1] then
               if high > f_upper_bound then retestDn[1] + 1 else retestDn[1] else 0;
def lastRetUp = if retestUp > 0 then if retestUp == retestUp[1] then lastRetUp[1] + 1 else 0 else 0;
def lastRetDn = if retestDn > 0 then if retestDn == retestDn[1] then lastRetDn[1] + 1 else 0 else 0;

plot bullPt  = if bull_signal then f_lower_bound else na;
plot bearPt  = if bear_signal then f_upper_bound else na;
plot bullLine = if is_bullish then f_lower_bound else na;
plot bearLine = if is_bearish then f_upper_bound else na;
plot midLine  = if showMidline then f_ma_base else na;

bullPt.SetLineWeight(2);
bearPt.SetLineWeight(2);
bullPt.SetPaintingStrategy(PaintingStrategy.POINTS);
bearPt.SetPaintingStrategy(PaintingStrategy.POINTS);
bullPt.SetDefaultColor(Color.CYAN);
bearPt.SetDefaultColor(Color.DOWNTICK);
midLine.SetDefaultColor(Color.GRAY);
bullLine.AssignValueColor(if lastRetUp < 5 and retestUp > 0 then Color.YELLOW else Color.CYAN);
bearLine.AssignValueColor(if lastRetDn < 5 and retestDn > 0 then Color.YELLOW else Color.DOWNTICK);

AddChartBubble(showBubbles and bullPt, bullPt, "Bull", Color.CYAN, no);
AddChartBubble(showBubbles and bearPt, bearPt, "Bear", Color.DOWNTICK);

AddCloud(ohlc4, bullLine, Color.DARK_GREEN);
AddCloud(bearLine, ohlc4, Color.DARK_RED);

AssignPriceColor(if !ColorCandles then Color.CURRENT else
                 if is_bullish then Color.GREEN else
                 if is_bearish then Color.RED else Color.GRAY);

#-- end of CODE
CODE: - 07/2024
CSS:
#// Indicator for TOS
#// © UAlgo
#indicator("RSI Trail [UAlgo]", shorttitle="RSI Trail [UAlgo]", overlay=true)
# Converted by Sam4Cok@Samer800    - 07/2024

input ColorCandles = no; #='Color Candles', inline="display"
input showBubbles = yes;
input timeframe = {Default "Chart", "Manual"};
input manualTimeframe = AggregationPeriod.FIFTEEN_MIN;
input MovingAverageType = {"SMA", "EMA", "WMA", "RMA", "HMA",default "T3", "McGinley", "KAMA"}; # "Mov Avg Type"
input MovAvgSrc  = FundamentalType.OHLC4;
input lookbackPeriod = 27;
input atrLength = 27;
input atrMultiplier = 1.5;
input rsiLowerThreshold = 40;   # "RSI Lower Bound"
input rsiUpperThreshold = 60;   # "RSI Upper Bound"
input showMidline = no;         # "Show Midline"

def na = Double.NaN;
def last = isNaN(close);
def src; def c; def h; def l; def ohlc;
Switch (timeframe) {
Case "Manual" :
    src = if !last then Fundamental(FundamentalType = MovAvgsrc, Period = manualTimeframe) else src[1];
    c = if !last then close(Period = manualTimeframe) else c[1];
    h = if !last then high(Period = manualTimeframe) else h[1];
    l = if !last then low(Period = manualTimeframe) else l[1];
    ohlc = if !last then ohlc4(Period = manualTimeframe) else ohlc[1];
Default :
    src = Fundamental(FundamentalType = FundamentalType.OHLC4);
    c = close;
    h = high;
    l = low;
    ohlc = ohlc4;
}
Script t3 {
    input source = close;
    input length = 21;
    input vf = 0.7;
    def ema1 = ExpAverage(source, length);
    def ema2 = ExpAverage(ema1, length);
    def gd1 = ema1 * (1 + vf) - ema2 * vf;
    def ema11 = ExpAverage(gd1, length);
    def ema22 = ExpAverage(ema11, length);
    def gd2 = ema11 * (1 + vf) - ema22 * vf;
    def ema111 = ExpAverage(gd2, length);
    def ema222 = ExpAverage(ema111, length);
    def gd3 = ema111 * (1 + vf) - ema222 * vf;
    plot out = gd3;
}
script kama {
    input source = close;
    input length = 28;
    def fast = 0.666;
    def slow = 0.064;
    def noisex = AbsValue(source - source[1]);
    def signal = AbsValue(source - source[length]);
    def noise = Sum(noisex, length);
    def ratio = if noise != 0 then signal / noise else 0;
    def smooth = Power(ratio * (fast - slow) + slow, 2);
    def KAMA = CompoundValue(1, KAMA[1] + smooth * (source - KAMA[1]), source);
    plot out = KAMA;
}
#// Function to select Moving Average
script f_get_ma {
    input _type = "EMA";
    input _src = ohlc4;
    input _length = 27;
    def sma = Average(_src, _length);
    def ema = ExpAverage(_src, _length);
    def wma = WMA(_src, _length);
    def rma = WildersAverage(_src, _length);
    def hma = HullMovingAvg(_src, _length);
    def kama = KAMA(_src, _length);
    def t3 = T3(_src, _length);
    def mcg = CompoundValue(1, if !mcg[1] then _src else
              (mcg[1] + (_src - mcg[1]) / (0.6 * _length * Power((_src / mcg[1]), 4))), _src);
    def ma = if _type == "SMA" then sma else
             if _type == "EMA" then ema else
             if _type == "WMA" then wma else
             if _type == "RMA" then rma else
             if _type == "HMA" then hma else
             if _type == "T3" then t3 else
             if _type == "KAMA" then kama else
             if _type == "McGinley" then mcg else ema;
    plot out = ma;
}
#// Calculate indicator values
script f_calculate_bounds {
    input _ma = ohlc4;
    input _range = 1;
    input _upper = 60;
    input _lower = 40;
    def upper_bound = _ma + (_upper - 50) / 10 * _range;
    def lower_bound = _ma - (50 - _lower) / 10 * _range;
    plot upper = upper_bound;
    plot lower = lower_bound;
}
def tr = TrueRange(h, c, l);
def nzTR = if isNaN(tr) then (h-l) else tr;
def f_volatility = WildersAverage(nzTR, atrLength) * atrMultiplier;
def f_ma_base = f_get_ma(MovingAverageType, src, lookbackPeriod);
def f_upper_bound = f_calculate_bounds(f_ma_base, f_volatility, rsiUpperThreshold, rsiLowerThreshold).upper;
def f_lower_bound = f_calculate_bounds(f_ma_base, f_volatility, rsiUpperThreshold, rsiLowerThreshold).lower;

#// Determine market state
def is_bullish;
def is_bearish;
def bull_signal;
def bear_signal;
def crossUp = (ohlc > f_upper_bound) and (ohlc[1] <= f_upper_bound[1]);
def crossDn = (c < f_lower_bound) and (c[1] >= f_lower_bound[1]);
if crossUp {
    bull_signal = !is_bullish[1];
    bear_signal = no;
    is_bullish = yes;
    is_bearish = no;
} else if crossDn {
    bull_signal = no;
    bear_signal = !is_bearish[1];
    is_bullish = no;
    is_bearish = yes;
} else {
    bull_signal = no;
    bear_signal = no;
    is_bullish = is_bullish[1];
    is_bearish = is_bearish[1];
}

def retestUp = if is_bullish[1] then
               if low < f_lower_bound then retestUp[1] + 1 else retestUp[1] else 0;
def retestDn = if is_bearish[1] then
               if high > f_upper_bound then retestDn[1] + 1 else retestDn[1] else 0;
def lastRetUp = if retestUp > 0 then if retestUp==retestUp[1] then lastRetUp[1] + 1 else 0 else 0;
def lastRetDn = if retestDn > 0 then if retestDn==retestDn[1] then lastRetDn[1] + 1 else 0 else 0;

plot bullPt  = if bull_signal then f_lower_bound else na;
plot bearPt  = if bear_signal then f_upper_bound else na;
plot bullLine = if is_bullish then f_lower_bound else na;
plot bearLine = if is_bearish then f_upper_bound else na;
plot midLine  = if showMidline then f_ma_base else na;

bullPt.SetLineWeight(2);
bearPt.SetLineWeight(2);
bullPt.SetPaintingStrategy(PaintingStrategy.POINTS);
bearPt.SetPaintingStrategy(PaintingStrategy.POINTS);
bullPt.SetDefaultColor(Color.CYAN);
bearPt.SetDefaultColor(Color.DOWNTICK);
midLine.SetDefaultColor(Color.GRAY);
bullLine.AssignValueColor(if lastRetUp < 5 and retestUp > 0 then Color.YELLOW else Color.CYAN);
bearLine.AssignValueColor(if lastRetDn < 5 and retestDn > 0 then Color.YELLOW else Color.DOWNTICK);

AddChartBubble(showBubbles and bullPt, bullPt, "Bull", Color.CYAN, no);
AddChartBubble(showBubbles and bearPt, bearPt, "Bear", Color.DOWNTICK);

AddCloud(ohlc4, bullLine, Color.DARK_GREEN);
AddCloud(bearLine, ohlc4, Color.DARK_RED);

AssignPriceColor(if !ColorCandles then Color.CURRENT else
                 if is_bullish then Color.GREEN else
                 if is_bearish then Color.RED else Color.GRAY);

#-- end of CODE
Last edited: