
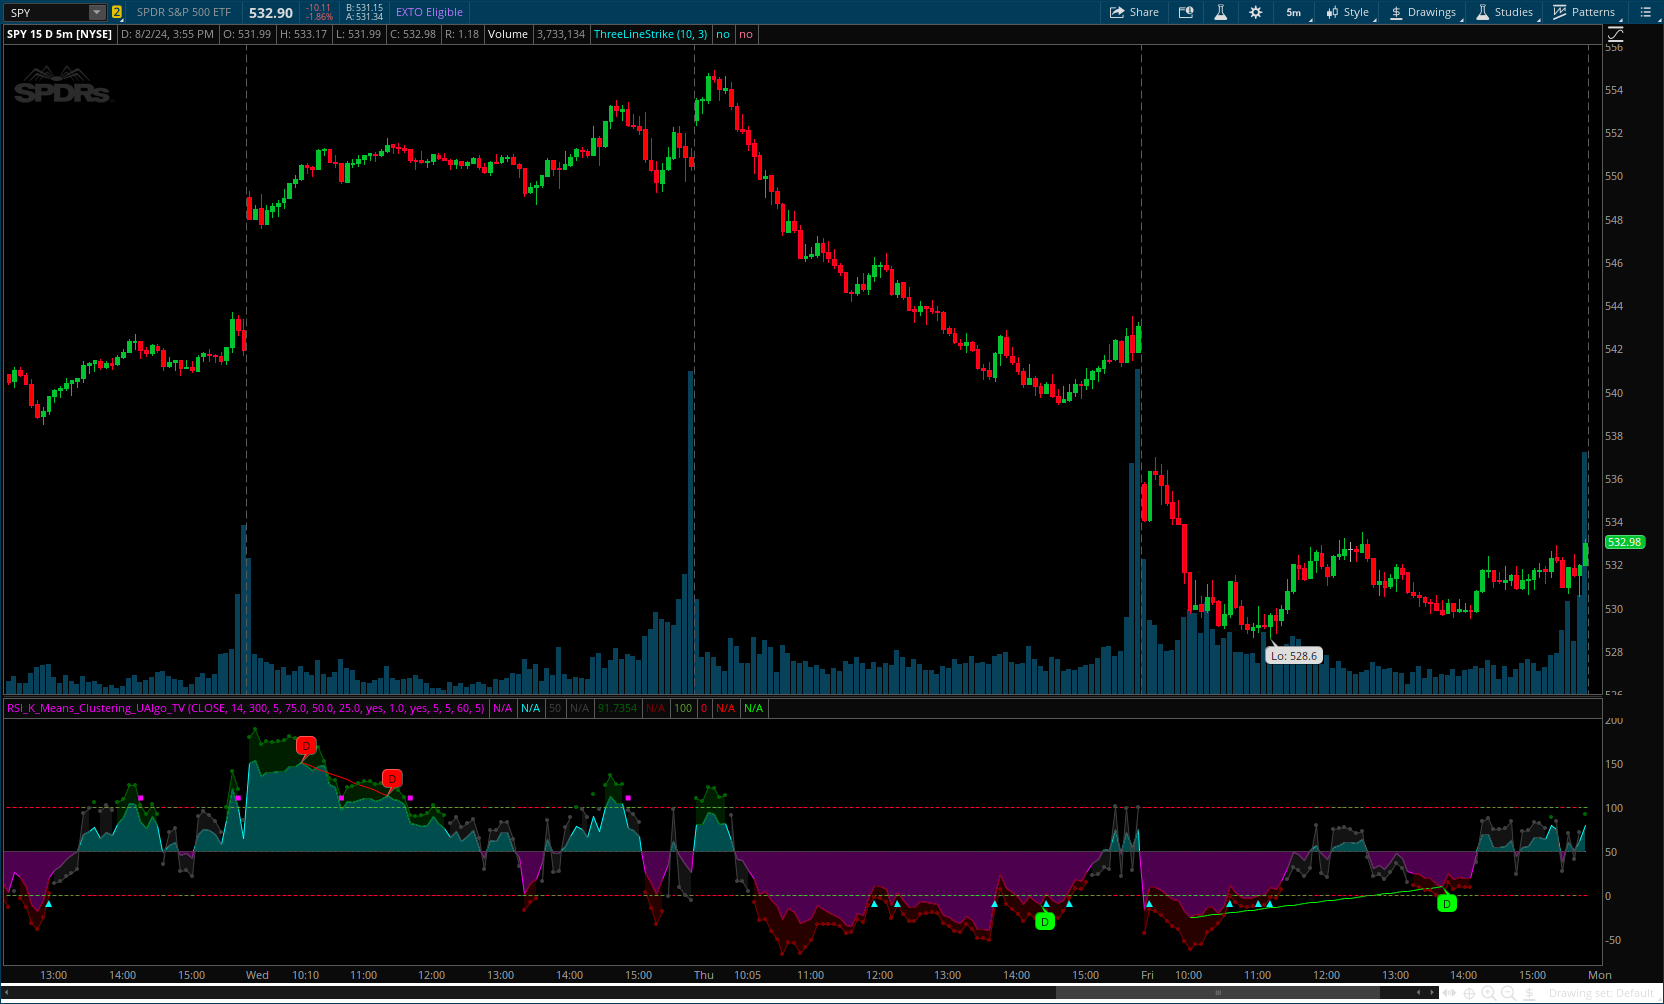
Author Message: - I added divergences - Results may not be typical
The "RSI K-Means Clustering " indicator is a technical analysis tool that combines the Relative Strength Index (RSI) with K-means clustering techniques. This approach aims to provide more nuanced insights into market conditions by categorizing RSI values into overbought, neutral, and oversold clusters.
The indicator adjusts these clusters dynamically based on historical RSI data, allowing for more adaptive and responsive thresholds compared to traditional fixed levels. By leveraging K-means clustering, the indicator identifies patterns in RSI behavior, which can help traders make more informed decisions regarding market trends and potential reversals.
CODE:
CSS:
#// Indicator for TOS
#// © UAlgo
#indicator(title = "RSI K-Means Clustering [UAlgo]", shorttitle = "RSI K-Means [UAlgo]")
# converted by Sam4Cok@Samer800    - 08/2024 - no Exact conv.
declare lower;

input rsiSource = close;             # "RSI Source"
input rsiLength = 14;                # "RSI Length"
input trainingDataSize = 300;        # "Training Data Size"
input numIterations = 5;             # "Number of K-means Iterations"
input initialOverboughtValue = 75.0; # "Initial Overbought Value"
input initialNeutralValue    = 50.0; # "Initial Neutral Value"
input initialOversoldValue   = 25.0; # "Initial Oversold Value"
input useAdjustedRsi = yes;          # "Use Adjusted RSI"
input distanceMultiplier = 1.0;      # "Numbers Distance Multiplier"

def na = Double.NaN;
def last = IsNaN(close);
def src = RSI(Price = rsiSource, Length = rsiLength);
def ob = initialOverboughtValue;
def nu = initialNeutralValue;
def os = initialOversoldValue;

# -- calcClusters
def overboughtCluster;
def neutralCluster;
def oversoldCluster;
def overboughtThreshold;
def neutralThreshold;
def oversoldThreshold;
def cntNu;
def cntOB;
def cntOS;
def overboughtThreshold1 = if overboughtThreshold[1] then overboughtThreshold[1] else initialOverboughtValue;
def neutralThreshold1 = if neutralThreshold[1] then neutralThreshold[1] else initialNeutralValue;
def oversoldThreshold1 = if oversoldThreshold[1] then oversoldThreshold[1] else initialOversoldValue;
def cnt = if IsNaN(cnt[1]) then 0 else if cnt[1] >= numIterations then 0 else cnt[1] + 1;
def cond = if IsNaN(cnt) then 0 else cnt;

if !cond {
    cntNu = fold j = 0 to trainingDataSize with k=0 do
             if AbsValue(src[j] - neutralThreshold1) < AbsValue(src[j] - overboughtThreshold1) and
               AbsValue(src[j] - neutralThreshold1) < AbsValue(src[j] - oversoldThreshold1) then
               k + 1 else k;
    neutralCluster = fold i = 0 to trainingDataSize with p=0 do
         if AbsValue(src[i] - neutralThreshold1) < AbsValue(src[i] - overboughtThreshold1) and
               AbsValue(src[i] - neutralThreshold1) < AbsValue(src[i] - oversoldThreshold1) then
               p + src[i] else p;
    cntOB = fold jj = 0 to trainingDataSize with kk=0 do
           if AbsValue(src[jj] - overboughtThreshold1) < AbsValue(src[jj] - neutralThreshold1) and
               AbsValue(src[jj] - overboughtThreshold1) < AbsValue(src[jj] - oversoldThreshold1) then
               kk + 1 else kk;
    overboughtCluster = fold ii = 0 to trainingDataSize with pp=0 do
         if AbsValue(src[ii] - overboughtThreshold1) < AbsValue(src[ii] - neutralThreshold1) and
               AbsValue(src[ii] - overboughtThreshold1) < AbsValue(src[ii] - oversoldThreshold1) then
               pp + src[ii] else pp;
    cntOS = fold jjj = 0 to trainingDataSize with kkk=0 do
             if (AbsValue(src[jjj] - neutralThreshold1) < AbsValue(src[jjj] - overboughtThreshold1) and
                AbsValue(src[jjj] - neutralThreshold1) < AbsValue(src[jjj] - oversoldThreshold1)) or
               (AbsValue(src[jjj] - overboughtThreshold1) < AbsValue(src[jjj] - neutralThreshold1) and
                AbsValue(src[jjj] - overboughtThreshold1) < AbsValue(src[jjj] - oversoldThreshold1))
                then kkk else kkk + 1;
    oversoldCluster = fold iii = 0 to trainingDataSize with ppp=0 do
             if (AbsValue(src[iii] - neutralThreshold1) < AbsValue(src[iii] - overboughtThreshold1) and
                AbsValue(src[iii] - neutralThreshold1) < AbsValue(src[iii] - oversoldThreshold1)) or
               (AbsValue(src[iii] - overboughtThreshold1) < AbsValue(src[iii] - neutralThreshold1) and
                AbsValue(src[iii] - overboughtThreshold1) < AbsValue(src[iii] - oversoldThreshold1))
                then ppp else ppp + src[iii];
    overboughtThreshold = (overboughtCluster / cntOB);
    neutralThreshold    = (neutralCluster / cntNu);
    oversoldThreshold   = (oversoldCluster / cntOS);
} else {
    overboughtCluster = 0;
    neutralCluster    = 0;
    oversoldCluster   = 0;
    cntNu = 0;
    cntOB = 0;
    cntOS = 0;
    overboughtThreshold = GetValue(overboughtThreshold1, cnt+1);
    neutralThreshold    = GetValue(neutralThreshold1, cnt+1);
    oversoldThreshold   = GetValue(oversoldThreshold1, cnt+1);
}
#-- end calcClusters
def avgOverbought = overboughtThreshold;
def avgNeutral    = neutralThreshold;
def avgOversold   = oversoldThreshold;
def positionRatio = 100 * ((src - avgOversold) / (avgOverbought - avgOversold));
def adjustedValue = if useAdjustedRSI then positionRatio else src;
def stdevValue = StDev(adjustedValue, rsiLength);
def CrossDn = (src < avgOverbought) and (src[1] >= avgOverbought[1]);
def CrossUp = (src > avgOversold) and (src[1] <= avgOversold[1]);

def plotMain = adjustedValue;
plot BearReveral = if CrossDn then (if useAdjustedRSI then 100 else avgOverbought) + 10  else na;
plot BullReveral = if CrossUp then (if useAdjustedRSI then 0 else avgOversold) - 10 else na;
plot plotNeutral = if last then na else if useAdjustedRSI then 50 else avgNeutral;
BearReveral.SetLineWeight(2);
BullReveral.SetLineWeight(2);
plotNeutral.SetDefaultColor(Color.DARK_GRAY);
BearReveral.SetPaintingStrategy(PaintingStrategy.SQUARES);
BullReveral.SetPaintingStrategy(PaintingStrategy.TRIANGLES);
BullReveral.SetDefaultColor(Color.CYAN);
BearReveral.SetDefaultColor(Color.MAGENTA);
AddCloud(plotMain, plotNeutral, Color.CYAN, Color.MAGENTA, yes);

def avgNu = AbsValue(src - avgNeutral);
def avgOb = AbsValue(src - avgOverbought);
def avgOs = AbsValue(src - avgOversold);
plot Ranging = if avgNu < avgOb and avgNu < avgOs then
             adjustedValue + (if src > avgNeutral then stdevValue * distanceMultiplier else
                              -stdevValue * distanceMultiplier) else na; # "Ranging Classification"
plot upTrend = if avgOb < avgNu and avgOb < avgOs then
            adjustedValue + (if src > avgNeutral then stdevValue * distanceMultiplier else
                              -stdevValue * distanceMultiplier) else na; # "Up-Trend Classification"
plot dnTrend = if avgOs < avgOb and avgOs < avgNu then
            adjustedValue + (if src > avgNeutral then stdevValue * distanceMultiplier else
                              -stdevValue * distanceMultiplier) else na; # "Down-Trend Classification"
Ranging.SetPaintingStrategy(PaintingStrategy.POINTS);
upTrend.SetPaintingStrategy(PaintingStrategy.POINTS);
dnTrend.SetPaintingStrategy(PaintingStrategy.POINTS);
upTrend.SetDefaultColor(Color.DARK_GREEN);
dnTrend.SetDefaultColor(Color.DARK_RED);
Ranging.SetDefaultColor(Color.DARK_GRAY);

AddCloud(upTrend, adjustedValue, Color.DARK_GREEN, Color.CURRENT, yes);
AddCloud(adjustedValue, dnTrend, Color.DARK_RED, Color.CURRENT, yes);
AddCloud(Ranging, adjustedValue, Color.DARK_GRAY, Color.DARK_GRAY, yes);

def colUp = if IsNaN(src) then 0 else
          if src > (if useAdjustedRSI then 100 else avgOverbought) then 255 else
          if src < avgNeutral then 0 else src * 2.55;
def colDn = if IsNaN(src) then 0 else
          if src < (if useAdjustedRSI then 0 else avgOversold) then 0 else
          if src > avgNeutral then 255 else src * 2.55;
plot overbought = if last then na else if useAdjustedRSI then 100 else avgOverbought;
plot oversold = if last then na else if useAdjustedRSI then 0 else avgOversold;
overbought.SetPaintingStrategy(PaintingStrategy.DASHES);
oversold.SetPaintingStrategy(PaintingStrategy.DASHES);
overbought.AssignValueColor(CreateColor(255 - colUp, colUp, 50));
oversold.AssignValueColor(CreateColor(colDn, 255 - colDn, 50));

#// 𝘿𝙄𝙑𝙀𝙍𝙂𝙀𝙉𝘾𝙀𝙎
input ShowDivergences = yes;
input PivotLookbackRight  = 5; # "Pivot Lookback Right"
input PivotLookbackLeft  = 5;  # "Pivot Lookback Left"
input MaxLookbackRange = 60;   # "Max of Lookback Range"
input MinLookbackRange = 5;    # "Min of Lookback Range"

script Pivots {
    input series    = close;
    input leftBars  = 10;
    input rightBars = 10;
    input isHigh = yes;
    def na = Double.NaN;
    def HH = series == Highest(series, leftBars + 1);
    def LL = series == Lowest(series, leftBars + 1);
    def pivotRange = (leftBars + rightBars + 1);
    def leftEdgeValue = if series[pivotRange] == 0 then na else series[pivotRange];
    def pvtCond = !IsNaN(series) and leftBars > 0 and rightBars > 0 and !IsNaN(leftEdgeValue);
    def barIndexH = if pvtCond then
                    fold i = 1 to rightBars + 1 with p=1 while p do
                    series > GetValue(series, - i) else na;
    def barIndexL = if pvtCond then
                    fold j = 1 to rightBars + 1 with q=1 while q do
                    series < GetValue(series, - j) else na;
    def PivotPoint;
    if isHigh {
        PivotPoint = if HH and barIndexH then series else na;
    } else {
        PivotPoint = if LL and barIndexL then series else na;
    }
    plot pvt = PivotPoint;
}

def flt_price = adjustedValue;
def p_r = PivotLookbackRight;
def p_l = PivotLookbackLeft;
def bar = BarNumber();
def pl = pivots(flt_price[p_r], p_l, p_r, no);
def ph = pivots(flt_price[p_r], p_l, p_r, yes);

def pivot_L = if isNaN(pl) then no else yes;
def pivot_H = if isNaN(ph) then no else yes;
def barPvtL = if pivot_L[1] then 0 else barPvtL[1] + 1;
def barPvtH = if pivot_H[1] then 0 else barPvtH[1] + 1;
def RangeLo = MinLookbackRange <= barPvtL and barPvtL <= MaxLookbackRange;
def RangeHi = MinLookbackRange <= barPvtH and barPvtH <= MaxLookbackRange;
def srcLo;
def srcHi;
def pvtPL;
def lastPlBar;
def pvtPH;
def fltHi;
def fltLo;
def fltPL;
def fltPH;
def lastPhBar;
if pivot_L {
    pvtPL = srcLo[1];
    srcLo = low[p_r];
    fltPL = fltLo[1];
    fltLo = flt_price[p_r];
    lastPlBar = bar - p_r;
    } else {
    pvtPL = pvtPL[1];
    srcLo = srcLo[1];
    fltPL = fltPL[1];
    fltLo = fltLo[1];
    lastPlBar = lastPlBar[1];
}
if pivot_H {
    pvtPH = srcHi[1];
    srcHi = high[p_r];
    fltPH = fltHi[1];
    fltHi = flt_price[p_r];
    lastPhBar = bar - p_r;
    } else {
    pvtPH = pvtPH[1];
    srcHi = srcHi[1];
    fltPH = fltPH[1];
    fltHi = fltHi[1];
    lastPhBar = lastPhBar[1];
}
def priceLL = low[p_r]  < pvtPL;
def priceHH = high[p_r] > pvtPH;
def cheb_filterLH = flt_price[p_r] < fltPH and rangeHi;
def cheb_filterHL = flt_price[p_r] > fltPL and rangeLo;

def bull_div = pivot_L and priceLL and cheb_filterHL and flt_price < os;
def bear_div = pivot_H and priceHH and cheb_filterLH and flt_price > ob;
def bearCond = bear_div[-p_r];
def bullCond = bull_div[-p_r];

AddChartBubble(ShowDivergences and bullCond, flt_price, "D", Color.GREEN, no);
AddChartBubble(ShowDivergences and bearCond, flt_price, "D", Color.RED);

##### Lines
#-- Bear Line
def priorPHBar = if bearCond then lastPhBar else priorPHBar[1];
#-- Bull Line
def priorPLBar = if bullCond then lastPlBar else priorPLBar[1];
def lastBullBar = if bullCond then bar else lastBullBar[1];
def lastBearBar = if bearCond then bar else lastBearBar[1];

def HighPivots = ShowDivergences and (bar == HighestAll(priorPHBar) or bar == HighestAll(lastBearBar));
def LowPivots  = ShowDivergences and (bar == HighestAll(priorPLBar) or bar == HighestAll(lastBullBar));

def pivotHigh = if HighPivots then flt_price else na;
def pivotLow  = if LowPivots  then flt_price else na;

plot PlotHline = if pivotHigh then pivotHigh else na;
PlotHline.EnableApproximation();
PlotHline.SetDefaultColor(Color.RED);

plot PlotLline = if pivotLow then pivotLow else na;
PlotLline.EnableApproximation();
PlotLline.SetDefaultColor(Color.GREEN);


#-- END of CODE