
mbarcala
Active member
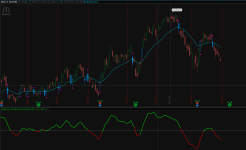
Another simple indicator from TradingView converted to TOS, Enjoy!
Upper Indicator: https://usethinkscript.com/threads/break-keltner-bands-bkb-for-thinkorswim.11220/
Lower Indicator: https://usethinkscript.com/threads/romi-trend-and-momentum-oscillator-for-thinkorswim.10207/
Photo
13502[/ATTACH]']

script
Upper Indicator: https://usethinkscript.com/threads/break-keltner-bands-bkb-for-thinkorswim.11220/
Lower Indicator: https://usethinkscript.com/threads/romi-trend-and-momentum-oscillator-for-thinkorswim.10207/
Photo
13502[/ATTACH]']
script
Code:
# Trend and Momentum Oscillator from TadingView converted by mbarcala
#Original Link: https://www.tradingview.com/script/8bJ87hfP-Romi-Trend-and-Momentum-Oscillator/
#study(title = "Romi Trend and Momentum Oscillator", shorttitle="ROMI")

declare lower;

input length = 20;
input slength = 6;

plot s2 = ExpAverage(close, slength) - ExpAverage(close, length);
s2.AssignValueColor(if s2 > 0 then Color.GREEN else if s2 < 0 then Color.RED else Color.CURRENT);
s2.SetLineWeight(2);
s2.HideBubble();

plot cline = 0;
cline.SetDefaultColor(Color.GRAY);
Attachments
Last edited by a moderator:

