#// Indicator for TOS
#// © veryfid
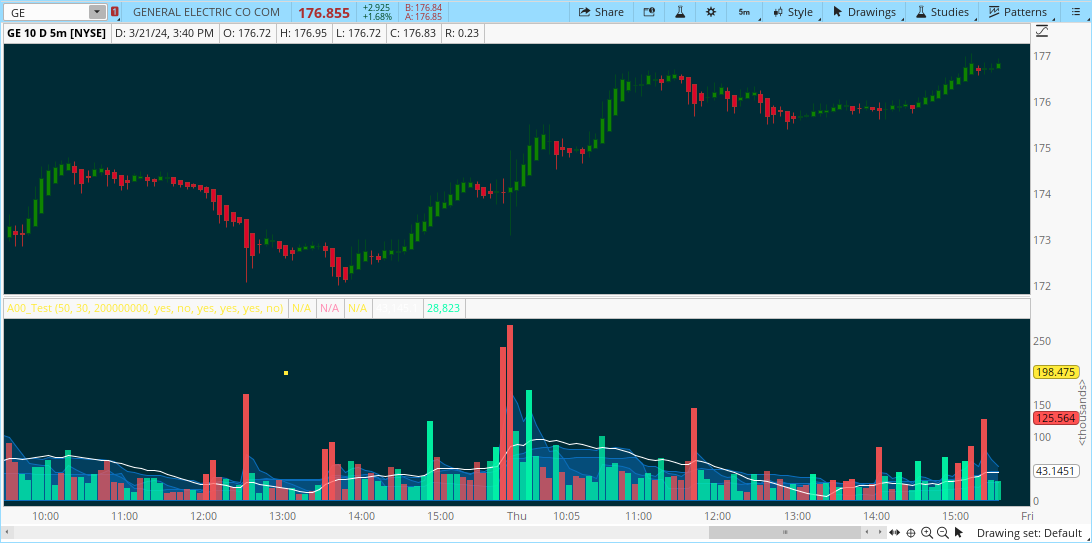
#study("Relative Volume", shorttitle="RVOL", format = format.volume)
# Converted by Sam4Cok@Samer800 - 03/2024
declare lower;
input lsmalength = 50; #,"LSMA Length",group = "General Settings")
input avglength = 30; #,"Lookback bars for Average",group = "General Settings")
input volalert = 200000000; #, title = "Alert when volume reaches",group = "General Settings")
input showEntrySignals = yes; #(true, "Show Entry Signals?",group = "Entry Signals")
input showRvol = no; #(false, "Show RVOL Calculation?",group = "General Settings")
input showLsma21 = yes; #(true,"Show LSMA 21 Entry Points", group = "Entry Signals")
input showLsma6 = yes; #(true,"Show LSMA 6 Entry Points",group = "Entry Signals")
input showAnomalies = yes; #(true, "Show Anomalies",group = "General Settings")
input ShowTrendColumns = no; #(false, title = "Show Trend Columns",group = "General Settings")
def na = Double.NaN;
DefineGlobalColor("up", CreateColor(0,255,170));
DefineGlobalColor("dn", CreateColor(255,82,82));
DefineGlobalColor("yel",CreateColor(255,235,59));
DefineGlobalColor("bg", CreateColor(10, 109, 187));
############## ALMA
script ALMA {
input Data = close;
input Window = 9;
input Sigma = 6;
input Offset = 0.85;
def m = (Offset * (Window - 1));
def s = Window/Sigma;
def SumVectorData = fold y = 0 to Window with WS do
WS + Exp(-(sqr(y-m))/(2*sqr(s))) * getvalue(Data, (Window-1)-y);
def SumVector = fold z = 0 to Window with CW do
CW + Exp(-(sqr(z-m))/(2*sqr(s)));
plot ALMA = SumVectorData / SumVector;
}
def len = 20;
def src = volume;
def hh = highest(src , 100);
def ma1 = Average(src, len);
def ma2 = Inertia(src, lsmalength);
def ma3 = Inertia(src, 21);
def ma4 = Inertia(src, 6);
def length = 21;
def std = 21;
def hullma = HullMovingAvg(src, length);
def windowsize = 9;
def offset = 0.85;
def sigma = 6;
def lsma2 = Inertia(ma2, len);
def a = ma2 - lsma2;
def zlsma = ma2 + a;
def almaMov = ALMA(src, windowsize, offset, sigma);
def stdv = stdev(src, std);
def dif = zlsma - ma2;
def clean = src - ma2;
#cond1 = crossover(ma2,0)
def cond1 = if showlsma21 and !showlsma6 then (ma2 crosses above 0) or (ma3 crosses above 0) else
if showlsma6 and !showlsma21 then (ma2 crosses above 0) or (ma4 crosses above 0) else
if showlsma6 and showlsma21 then (ma2 crosses above 0) or (ma3 crosses above 0) or (ma4 crosses above 0) else
(ma2 crosses above 0);
def cond2 = (src crosses above volalert);
def cond3 = src > ma2;
AddCloud(almaMov, 0, GlobalColor("bg"), GlobalColor("bg"), yes);
AddCloud(stdv, 0, GlobalColor("bg"), GlobalColor("bg"), yes);
AddCloud(ma1, 0, GlobalColor("bg"), GlobalColor("bg"), yes);
plot EntrySignal = if showEntrySignals and cond1 then hh else na; # "Entry Signal"
plot Anomalies = if showAnomalies and clean > stdv then src else na; # "Entry Signal"
plot TrendColumns = if ShowTrendColumns and dif > 0 then dif else na; # #fff9c4, title = "Trend Columns")
plot LSMA = ma2; # "LSMA"
plot volHist = src; # "Volume"
EntrySignal.SetPaintingStrategy(PaintingStrategy.SQUARES);
EntrySignal.SetDefaultColor(GlobalColor("yel"));
Anomalies.AssignValueColor(if close > open then GlobalColor("up") else GlobalColor("dn"));
Anomalies.SetPaintingStrategy(PaintingStrategy.SQUARED_HISTOGRAM);
TrendColumns.SetDefaultColor(GlobalColor("yel"));
TrendColumns.SetPaintingStrategy(PaintingStrategy.SQUARED_HISTOGRAM);
LSMA.SetDefaultColor(Color.WHITE);
volHist.SetPaintingStrategy(PaintingStrategy.SQUARED_HISTOGRAM);
volHist.AssignValueColor(if close > open then GlobalColor("up") else GlobalColor("dn"));
def avg = Average(src[1], avglength);
def rvol = src / avg;
AddLabel(showrvol, "RVOL(" + Round(rvol, 2) + ")", Color.WHITE);
#-- END of CODE