mbarcala
Active member
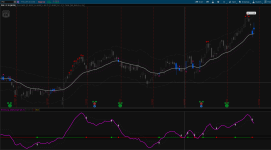
This is another visual idea of QQE
Upper Indicator: https://usethinkscript.com/threads/break-keltner-bands-bkb-for-thinkorswim.11220/
Photo
14900[/ATTACH]']

script
Upper Indicator: https://usethinkscript.com/threads/break-keltner-bands-bkb-for-thinkorswim.11220/
Photo
14900[/ATTACH]']
script
Code:
# QQE Indicator v2 by mbarcala at useThinkScript.com

declare lower;

input RSI_Period = 20;
input Slow_Factor = 5;

def RSIndex = 4.236;
def Wilder_Period = RSI_Period * 2 - 1;
def rsi = RSI(price = close, length = RSI_Period).RSI;

plot QQE = ExpAverage(rsi, Slow_Factor) - 50;
QQE.SetDefaultColor(Color.MAGENTA);
QQE.SetLineWeight(2);
QQE.HideBubble();
QQE.HideTitle();

def atr_rsi = AbsValue(QQE[1] - QQE);
def atr_rsi_ma = ExpAverage(atr_rsi, Wilder_Period);
def DeltaFastAtrRsi = ExpAverage(atr_rsi_ma, Wilder_Period) * RSIndex;
def newshortband =  QQE + DeltaFastAtrRsi;
def newlongband = QQE - DeltaFastAtrRsi;

def longband = if QQE[1] > longband[1] and QQE > longband[1] then max(longband[1],newlongband) else newlongband;
def shortband = if QQE[1] < shortband[1] and  QQE < shortband[1] then min(shortband[1], newshortband) else newshortband;
def trend = if Crosses(QQE, shortband[1]) then 1 else if Crosses(longband[1], QQE) then -1 else if !IsNAN(trend[1]) then trend[1] else 1;

plot pFastAtrRsiTL = if trend == 1 then longband else shortband;
pFastAtrRsiTL.SetStyle(Curve.SHORT_DASH);
pFastAtrRsiTL.SetDefaultColor(Color.DARK_GRAY);

plot sdir = if QQE > pFastAtrRsiTL then 0 else if QQE < pFastAtrRsiTL then 0 else Double.NaN;
sdir.AssignValueColor(if QQE > pFastAtrRsiTL then Color.GREEN else if QQE < pFastAtrRsiTL then Color.RED else Color.CURRENT);

plot sdirsq = if QQE crosses above pFastAtrRsiTL then 0 else if QQE crosses below pFastAtrRsiTL then 0 else Double.NaN;
sdirsq.SetPaintingStrategy(PaintingStrategy.SQUARES);
sdirsq.AssignValueColor(if QQE crosses above pFastAtrRsiTL then Color.GREEN else if QQE crosses below pFastAtrRsiTL then Color.RED else Color.CURRENT);
sdirsq.SetLineWeight(3);

plot midline = 0;
midline.SetDefaultColor(Color.DARK_GRAY);
midline.SetLineWeight(1);
midline.HideTitle();

plot upArrow = if QQE crosses above pFAstAtrRsiTL then QQE - 0.5 else Double.NaN;
upArrow.SetPaintingStrategy(PaintingStrategy.ARROW_UP);
upArrow.SetDefaultColor(Color.WHITE);
upArrow.SetLineWeight(1);
upArrow.HideBubble();
upArrow.HideTitle();

plot dnArrow = if QQE crosses below pFastAtrRsiTL then QQE - -0.5 else Double.NaN;
dnArrow.SetPaintingStrategy(PaintingStrategy.ARROW_DOWN);
dnArrow.SetDefaultColor(Color.WHITE);
dnArrow.SetLineWeight(1);
dnArrow.HideBubble();
dnArrow.HideTitle();

def upZone = midline + 2;
def dnZone = midline - 2;
AddCloud(upZone, dnZone, Color.BLACK);
Attachments
Last edited by a moderator:

