Price spike 10 bars ago then pullback to 50EMA

Hello @halcyonguy

Thanks for all your help in coding the strategy. Can you please help me to create a scan code for the following strategy? Thanks.

  1. A price surge of 30% or higher occurred 10 bars ago.
  2. EMAs (20, 50, 200) are stacked in a bullish manner
  3. Price pulled back to 50 EMAs within a margin of 1% or less

I hope the attached image can adequately convey my message. Thank you once again.

eG3sW0m.png
 
Hello @halcyonguy

Thanks for all your help in coding the strategy. Can you please help me to create a scan code for the following strategy? Thanks.

  1. A price surge of 30% or higher occurred 10 bars ago.
  2. EMAs (20, 50, 200) are stacked in a bullish manner
  3. Price pulled back to 50 EMAs within a margin of 1% or less

I hope the attached image can adequately convey my message. Thank you once again.

what is max bars allowed for the price jump? 5,10,50,...?
not sure what 10 bars ago is, ago from what? what does that matter? what if the peak was 5 bars ago?
"A price surge of 30% or higher occurred 10 bars ago."
 
Last edited:

Join useThinkScript to post your question to a community of 21,000+ developers and traders.

Hello @halcyonguy

Thanks for all your help in coding the strategy. Can you please help me to create a scan code for the following strategy? Thanks.

  1. A price surge of 30% or higher occurred 10 bars ago.
  2. EMAs (20, 50, 200) are stacked in a bullish manner
  3. Price pulled back to 50 EMAs within a margin of 1% or less

I hope the attached image can adequately convey my message. Thank you once again.
why does a jump have to happen 10 bars ago? why not 9? why not 20? why any number. do you mean , the jump happened during the past 10 bars?


i just did something similar, with a sequence of signals. i will modify it for your code
https://usethinkscript.com/threads/20-ema-break-retrace-scan.18806/#post-142148


i got side tracked with a gann code.
will make some guesses on this and look at it today
 
Last edited:
what is max bars allowed for the price jump? 5,10,50,...?
not sure what 10 bars ago is, ago from what? what does that matter? what if the peak was 5 bars ago?
A price surge of 30% or higher occurred 10 bars ago.
  1. what is max bars allowed for the price jump? 5,10,50,...?
Max 20 bars should be allowed

2. not sure what 10 bars ago is, ago from what? what does that matter? what if the peak was 5 bars ago?

10 bars ago from the current close. ( Actually, I want to catch the price spike and then pull back. In the above example, the price spike happened in after hours while perfect pullback happened near opening)


Thanks for your answer. Hope I explained myself well.

why does a jump have to happen 10 bars ago? why not 9? why not 20? why any number. do you mean , the jump happened during the past 10 bars?


i just did something similar, with a sequence of signals. i will modify it for your code
https://usethinkscript.com/threads/20-ema-break-retrace-scan.18806/#post-142148
My idea is to capture the after-hours (AH) spike in the next-day openings which are still uptrend. As indicated by the attached image in the first post, LIDR spiked in Ah, then faded back to 30 EMA while EMAs are bullishly stacked. I hope I explained myself well. Thanks
 
Last edited by a moderator:
  1. what is max bars allowed for the price jump? 5,10,50,...?
Max 20 bars should be allowed

2. not sure what 10 bars ago is, ago from what? what does that matter? what if the peak was 5 bars ago?

10 bars ago from the current close. ( Actually, I want to catch the price spike and then pull back. In the above example, the price spike happened in after hours while perfect pullback happened near opening)


Thanks for your answer. Hope I explained myself well.


My idea is to capture the after-hours (AH) spike in the next-day openings which are still uptrend. As indicated by the attached image in the first post, LIDR spiked in Ah, then faded back to 30 EMA while EMAs are bullishly stacked. I hope I explained myself well. Thanks


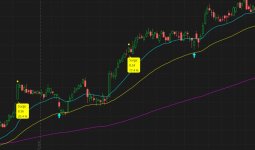
here is an upper study to experiment with
it draws a yellow dot when a surge happens, and a bubble that shows the dollar amount and the percent of the surge.
it draws a cyan arrow when a retrace happens

i changed the default numbers so i could get some signals

i don't know if this will work for a scan. would have to replace all the plots with def, except last plot. then disable the bubble.


test on WFC day chart


Code:
#price_spike_pullback

#https://usethinkscript.com/threads/price-spike-10-bars-ago-then-pullback-to-50ema.18744/#post-142263
#Price spike 10 bars ago then pullback to 50EMA

def na = Double.NaN;
def bn = BarNumber();

#-------------------------------
#A price surge of 30% or higher
# occurred 10 bars ago. ?
# within 20 bars


#input surge_percent = 30.0;
#input surge_percent = 20.0;
input surge_percent = 17.0;
input surge_max_bars = 20;

# find bar #'s of high and low. low has to be first


def minlooff = GetMinValueOffset(low, surge_max_bars);
def maxhioff = GetMaxValueOffset(high, surge_max_bars);

def hi;
def lo;
def surge;
def surgeper;
if bn == 1 then {
hi = 0;
lo = 0;
surge = 0;
surgeper = 0;
} else if (maxhioff < minlooff) then {
# max rise
hi = getvalue(high,maxhioff);
lo = getvalue(low,minlooff);
surge = round(hi - lo,2);
surgeper = round(100*surge/lo,1);
} else {
hi = 0;
lo = 0;
surge = 0;
surgeper = 0;
}


def issurge = surgeper >= surge_percent;


addchartbubble(0, low,
maxhioff + "\n" +
minlooff + "\n" +
hi + " H\n" +
lo + " L\n" +
surge + " S\n" +
surgeper + " %\n"
, (if surge > 0 then color.yellow else color.gray), no);


#-------------------------------
#EMAs (20, 50, 200) are stacked in a bullish manner

def data = close;

input avg1_type = AverageType.exponential;
#input avg1_type = AverageType.Simple;
input avg1_length = 20;
def avg1 = MovingAverage(avg1_type, data, avg1_length );

input avg2_type = AverageType.exponential;
input avg2_length = 50;
def avg2 = MovingAverage(avg2_type, data, avg2_length );

input avg3_type = AverageType.exponential;
input avg3_length = 200;
def avg3 = MovingAverage(avg3_type, data, avg3_length );


input show_average_lines = yes;
plot zavg1 = if show_average_lines then avg1 else na;
plot zavg2 = if show_average_lines then avg2 else na;
plot zavg3 = if show_average_lines then avg3 else na;

zavg1.SetDefaultColor(Color.cyan);
zavg1.setlineweight(1);
zavg1.hidebubble();

zavg2.SetDefaultColor(Color.yellow);
zavg2.setlineweight(1);
zavg2.hidebubble();

zavg3.SetDefaultColor(Color.magenta);
zavg3.setlineweight(1);
zavg3.hidebubble();


def xup = avg1 crosses above avg2;
def xdwn = avg1 crosses below avg2;

def stackup = avg1 > avg2 and avg2 > avg3;
def stackdwn = avg1 < avg2 and avg2 < avg3;


#-------------------------------

# check if all 3 avgs are rising


#-------------------------------
#Price pulled back to 50 EMAs within a margin of 1% or less


#input retrace_near_per = 1.0;
input retrace_near_per = 3.0;
def avgnear = close - avg2;
def avgnearper = round(100*avgnear/avg2,1);

def retrace = avgnearper <= retrace_near_per;

#-------------------------------
#-------------------------------


def maxseq = 2;
def seq = if bn == 1 then 0
 else if seq[1] == 2 then 0
 else if seq[1] == 0 and issurge and stackup then 1
 #else if seq[1] == 1 and stackup then 2
 else if seq[1] == 1 and retrace then 2
 else seq[1];

def y = 0.007;
plot zup1 = if seq == 1 and seq[1] == 0 then high*(1+y) else na;
zup1.SetPaintingStrategy(PaintingStrategy.points);
zup1.SetDefaultColor(Color.yellow);
zup1.setlineweight(3);
zup1.hidebubble();


plot zup2 = if seq == maxseq then avg2 else na;
zup2.SetPaintingStrategy(PaintingStrategy.ARROW_UP);
zup2.SetDefaultColor(Color.cyan);
zup2.setlineweight(3);
zup2.hidebubble();


addchartbubble((seq == 1 and seq[1] == 0), (low*(1-y)),
"Surge\n" +
surge + "\n" +
surgeper + " %\n"
, color.yellow, no);

#-----------------------------
# scan plot
#plot z = seq == maxseq;

#
 

Attachments

  • img2.JPG
    img2.JPG
    70.9 KB · Views: 89

Similar threads

Not the exact question you're looking for?

Start a new thread and receive assistance from our community.

87k+ Posts
474 Online
Create Post

Similar threads

Similar threads

The Market Trading Game Changer

Join 2,500+ subscribers inside the useThinkScript VIP Membership Club
  • Exclusive indicators
  • Proven strategies & setups
  • Private Discord community
  • ‘Buy The Dip’ signal alerts
  • Exclusive members-only content
  • Add-ons and resources
  • 1 full year of unlimited support

Frequently Asked Questions

What is useThinkScript?

useThinkScript is the #1 community of stock market investors using indicators and other tools to power their trading strategies. Traders of all skill levels use our forums to learn about scripting and indicators, help each other, and discover new ways to gain an edge in the markets.

How do I get started?

We get it. Our forum can be intimidating, if not overwhelming. With thousands of topics, tens of thousands of posts, our community has created an incredibly deep knowledge base for stock traders. No one can ever exhaust every resource provided on our site.

If you are new, or just looking for guidance, here are some helpful links to get you started.

What are the benefits of VIP Membership?
VIP members get exclusive access to these proven and tested premium indicators: Buy the Dip, Advanced Market Moves 2.0, Take Profit, and Volatility Trading Range. In addition, VIP members get access to over 50 VIP-only custom indicators, add-ons, and strategies, private VIP-only forums, private Discord channel to discuss trades and strategies in real-time, customer support, trade alerts, and much more. Learn all about VIP membership here.
How can I access the premium indicators?
To access the premium indicators, which are plug and play ready, sign up for VIP membership here.
Back
Top