Babel
New member
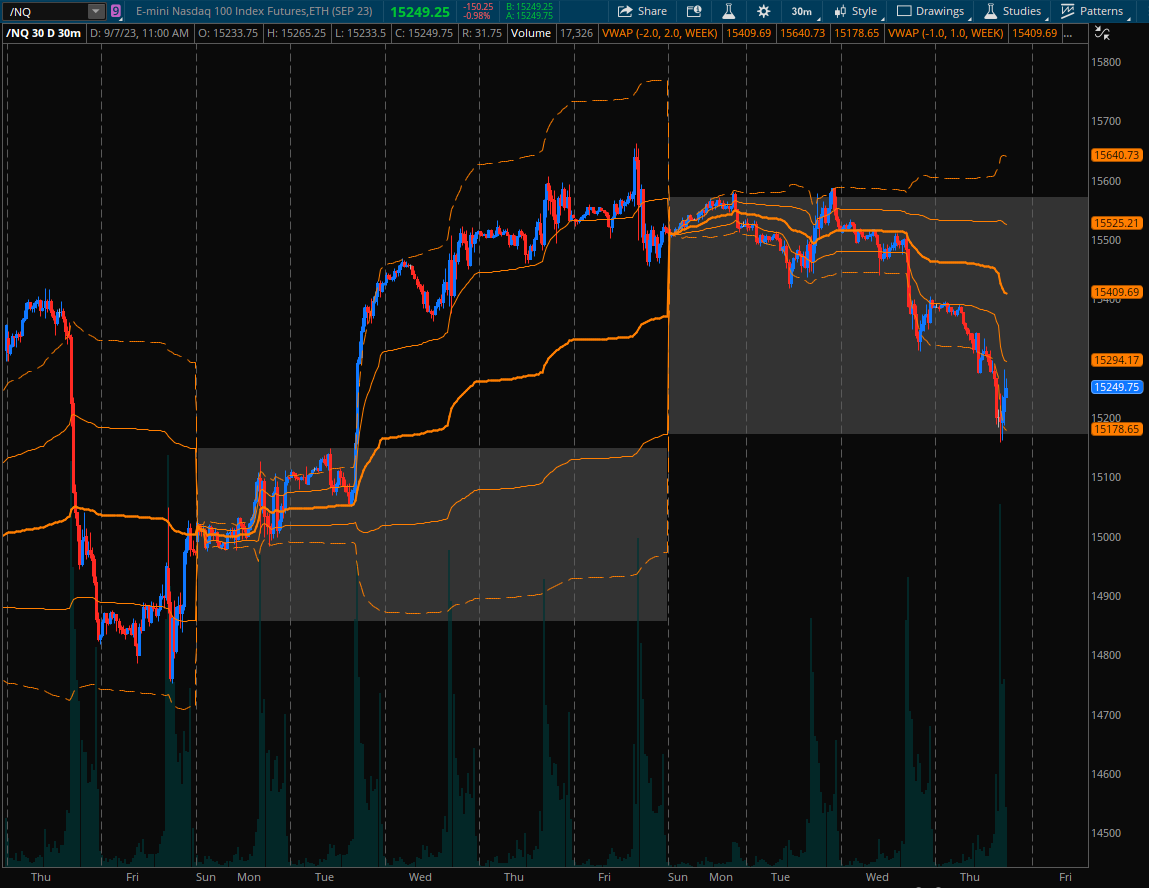
Hello, I'm hoping someone better with thinkscript can help me build this. The concept is straight forward, I would like to take the closing prices of the last weekly VWAPs +1 and -1 standard deviations and plot as a rectangle/cloud on top of the current week.
This can be considered as similar to a volume profile's value area and can be very useful in helping to gauge strength/weakness in the current week's auction.
Below /NQ chart shows that this weeks value has almost completely bounded the range and fading the edges has provided multiple opportunities.

TIA
This can be considered as similar to a volume profile's value area and can be very useful in helping to gauge strength/weakness in the current week's auction.
Below /NQ chart shows that this weeks value has almost completely bounded the range and fading the edges has provided multiple opportunities.

TIA
