predictive POC/VAL/VAH for the next trading day

LarryMunson

New member
I cannot seem to find predictive Daily POC and VAL/VAH for the future day.
(You will see in the chart, for example, there is predictive POC/VAL/VAH for the next trading day).

1700658442712.png
 
Last edited by a moderator:
Solution
I cannot seem to find predictive Daily POC and VAL/VAH for the future day.
(You will see in the chart, for example, there is predictive POC/VAL/VAH for the next trading day).

View attachment 20253

After looking at this, it appears this is just the Volumeprofile offset with the previous day plotted on today. The "Predictive" profile is then today's profile plotted forward to the next day.

The image shows the new study with a standard Volumeprofile study set to show 2 profiles. As you can see the standard's dotted lines are plotted on the next day.

Screenshot 2023-11-24 111213.jpg
Code:
#VolumeProfile_Offet_Today_to_Tomorrow

def height = PricePerRow.AUTOMATIC;
input timePerProfile = {CHART, MINUTE, HOUR, default DAY, WEEK, MONTH, "OPT EXP", BAR}...
I cannot seem to find predictive Daily POC and VAL/VAH for the future day.
(You will see in the chart, for example, there is predictive POC/VAL/VAH for the next trading day).

View attachment 20253

After looking at this, it appears this is just the Volumeprofile offset with the previous day plotted on today. The "Predictive" profile is then today's profile plotted forward to the next day.

The image shows the new study with a standard Volumeprofile study set to show 2 profiles. As you can see the standard's dotted lines are plotted on the next day.

Screenshot 2023-11-24 111213.jpg
Code:
#VolumeProfile_Offet_Today_to_Tomorrow

def height = PricePerRow.AUTOMATIC;
input timePerProfile = {CHART, MINUTE, HOUR, default DAY, WEEK, MONTH, "OPT EXP", BAR};
input multiplier = 1;
input profiles = 2;
input valueAreaPercent = 70;

def period;
def yyyymmdd = GetYYYYMMDD();
def seconds = SecondsFromTime(0);
def month = GetYear() * 12 + GetMonth();
def day_number = DaysFromDate(First(yyyymmdd)) + GetDayOfWeek(First(yyyymmdd));
def dom = GetDayOfMonth(yyyymmdd);
def dow = GetDayOfWeek(yyyymmdd - dom + 1);
def expthismonth = (if dow > 5 then 27 else 20) - dow;
def exp_opt = month + (dom > expthismonth);
switch (timePerProfile) {
case CHART:
    period = 0;
case MINUTE:
    period = Floor(seconds / 60 + day_number * 24 * 60);
case HOUR:
    period = Floor(seconds / 3600 + day_number * 24);
case DAY:
    period = CountTradingDays(Min(First(yyyymmdd), yyyymmdd), yyyymmdd) - 1;
case WEEK:
    period = Floor(day_number / 7);
case MONTH:
    period = Floor(month - First(month));
case "OPT EXP":
    period = exp_opt - First(exp_opt);
case BAR:
    period = BarNumber() - 1;
}

def count = CompoundValue(1, if period != period[1] then (count[1] + period - period[1]) % multiplier else count[1], 0);
def cond = count < count[1] + period - period[1];
profile vol = VolumeProfile("startNewProfile" = cond, "numberOfProfiles" = profiles, "pricePerRow" = height, "value area percent" = valueAreaPercent, onExpansion = no);

#Prior Day High/Low ValueAreas
def HVA = if IsNaN(vol.GetHighestValueArea()) then HVA[1] else vol.GetHighestValueArea();
def pHVA = CompoundValue(1, if cond then HVA[1] else pHVA[1], Double.NaN);
def LVA = if IsNaN(vol.GetLowestValueArea()) then LVA[1] else vol.GetLowestValueArea();
def pLVA = CompoundValue(1, if cond then LVA[1] else pLVA[1], Double.NaN);

plot PrevHVA = pHVA;
plot PrevLVA = pLVA;
PrevHVA.SetDefaultColor(Color.YELLOW);
PrevLVA.SetDefaultColor(Color.YELLOW);
PrevHVA.SetPaintingStrategy(PaintingStrategy.HORIZONTAL);
PrevLVA.SetPaintingStrategy(PaintingStrategy.HORIZONTAL);

#Prior Day POC Calculated
def POC = if IsNaN(vol.GetPointOfControl()) then POC[1] else vol.GetPointOfControl();
def pPOC = CompoundValue (1, if cond then POC[1] else pPOC[1], Double.NaN);

plot PrevPOC = pPOC;
PrevPOC.SetPaintingStrategy(PaintingStrategy.HORIZONTAL);
PrevPOC.SetDefaultColor(Color.MAGENTA);
 
Solution

Join useThinkScript to post your question to a community of 21,000+ developers and traders.

I cannot seem to find predictive Daily POC and VAL/VAH for the future day.
(You will see in the chart, for example, there is predictive POC/VAL/VAH for the next trading day).
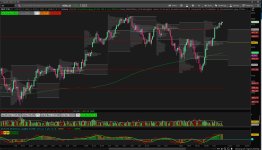
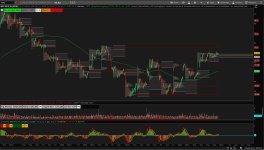
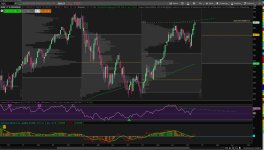
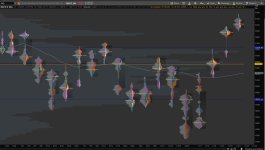
The image you have is of a indicator system called MarketWebs...you can see their logo in the top left of the chart. They have a twitter account.... its what I use. Its my #1 favorite system and the only one that I would be willing the pay $$ for....because yeah you do gotta buy it. It does a whole lot of stuff, but essentially its based off of MarketProfile, gives you daily/weekly/monthly/yearly value areas and extends VPOCs. You can also use the setting where it takes the average between the marketprofile (time) and volume profile (volume). Mine is an older version and I had to get a script I found on this website to add the extended VPOCs. Theres a script you can find on this board that will project the previous timeframes volume profile forward, its on here somewhere I found it when I first started looking for a marketwebs script somewhere, but its not the same thing, not close. Theres a ton of other stuff that goes into MarketWebs. But ToS does have a native MarketProfile, its called "MonkeyBars" I'll attach a couple of images of my MarketWebs and my MarketProfile......but you are definitely on the right track....get your MarketProfile going, look into Auction Theory and what it is but don't waste a huge amount of time on it.....pay close attention to MTF Value Areas, just check out the images attached and how price interacts with them and the VPOCS. ESPECIALLY pay close attention to the the single print zones, they're the strongest areas out there. Cheers
 

Attachments

  • Screenshot 2023-11-24 194238.jpg
    Screenshot 2023-11-24 194238.jpg
    268.1 KB · Views: 234
  • Screenshot 2023-11-24 195151.jpg
    Screenshot 2023-11-24 195151.jpg
    232.1 KB · Views: 229
  • Screenshot 2023-11-24 195827.jpg
    Screenshot 2023-11-24 195827.jpg
    246.8 KB · Views: 225
  • Screenshot 2023-11-24 200141.jpg
    Screenshot 2023-11-24 200141.jpg
    165.4 KB · Views: 240
Last edited by a moderator:

Similar threads

Not the exact question you're looking for?

Start a new thread and receive assistance from our community.

87k+ Posts
349 Online
Create Post

Similar threads

Similar threads

The Market Trading Game Changer

Join 2,500+ subscribers inside the useThinkScript VIP Membership Club
  • Exclusive indicators
  • Proven strategies & setups
  • Private Discord community
  • ‘Buy The Dip’ signal alerts
  • Exclusive members-only content
  • Add-ons and resources
  • 1 full year of unlimited support

Frequently Asked Questions

What is useThinkScript?

useThinkScript is the #1 community of stock market investors using indicators and other tools to power their trading strategies. Traders of all skill levels use our forums to learn about scripting and indicators, help each other, and discover new ways to gain an edge in the markets.

How do I get started?

We get it. Our forum can be intimidating, if not overwhelming. With thousands of topics, tens of thousands of posts, our community has created an incredibly deep knowledge base for stock traders. No one can ever exhaust every resource provided on our site.

If you are new, or just looking for guidance, here are some helpful links to get you started.

What are the benefits of VIP Membership?
VIP members get exclusive access to these proven and tested premium indicators: Buy the Dip, Advanced Market Moves 2.0, Take Profit, and Volatility Trading Range. In addition, VIP members get access to over 50 VIP-only custom indicators, add-ons, and strategies, private VIP-only forums, private Discord channel to discuss trades and strategies in real-time, customer support, trade alerts, and much more. Learn all about VIP membership here.
How can I access the premium indicators?
To access the premium indicators, which are plug and play ready, sign up for VIP membership here.
Back
Top