
Author Message:
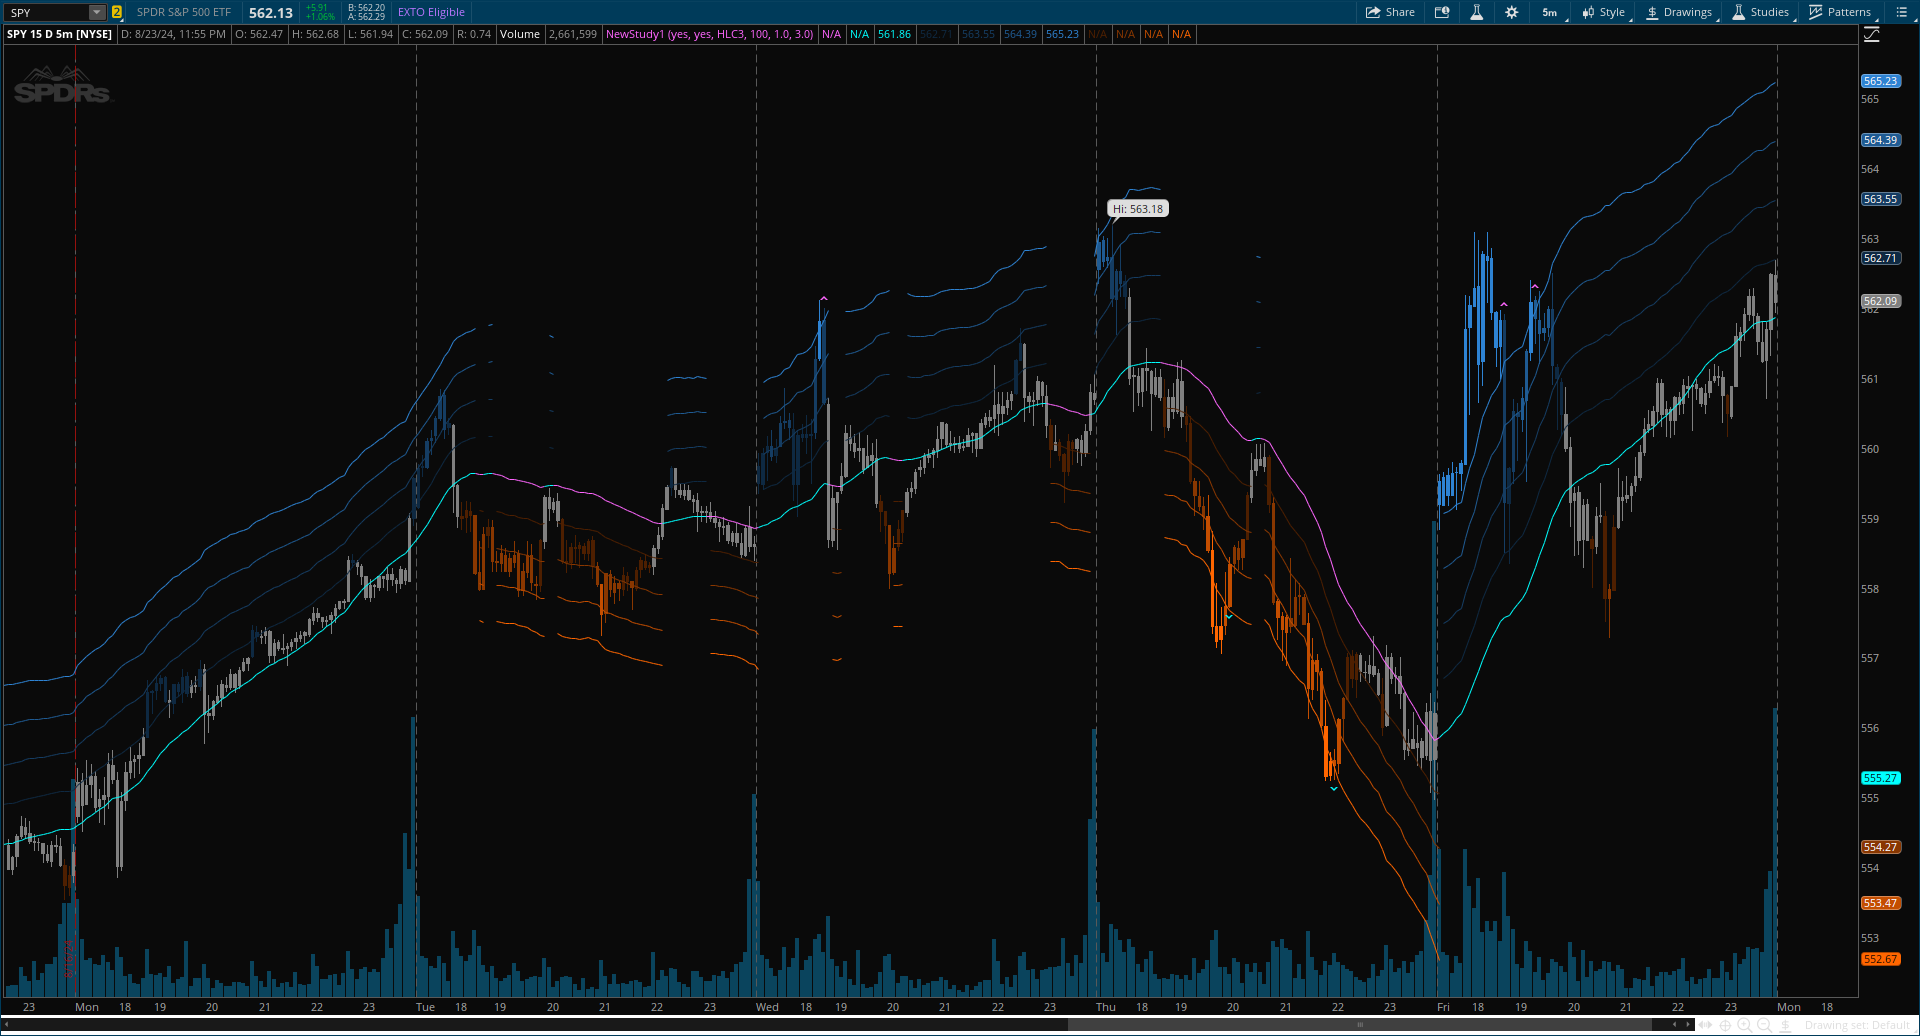
The Polynomial Regression Keltner Channel indicator is an advanced technical analysis tool that combines polynomial regression with dynamic Keltner Channels. This indicator provides traders with a sophisticated method for trend analysis, volatility assessment, and identifying potential overbought and oversold conditions.
CODE:
CSS:
#// Indicator for TOS
#//@ChartPrime
#indicator("Polynomial Regression Keltner Channel [ChartPrime]", "PR Keltner Channel [ChartPrime]"
# Converted by Sam4Cok@Samer800    - 08/2024

input colorBars = yes;
input showChannel = yes;
input Source = FundamentalType.HLC3;             # "Source"
input higherTimeframe = AggregationPeriod.MIN;
input length = 100;              # "Length"
input channelSensitivity  = 1.0;
input baseAtrMultiplier = 3.0;   # "Base ATR Multiplier"

def na = Double.NaN;
def multi = baseATRMultiplier / 10;
def current = GetAggregationPeriod();
def tf = Max(current, higherTimeframe);
def src = Fundamental(FundamentalType = Source, Period = tf);
#--Color
DefineGlobalColor("up4", CreateColor(46, 131,211));
DefineGlobalColor("up3", CreateColor(31, 91, 147));
DefineGlobalColor("up2", CreateColor(21, 61, 99));
DefineGlobalColor("up1", CreateColor(14, 41, 66));
DefineGlobalColor("dn4", CreateColor(255,102,0));
DefineGlobalColor("dn3", CreateColor(196,78, 0));
DefineGlobalColor("dn2", CreateColor(137,55, 0));
DefineGlobalColor("dn1", CreateColor(78, 31, 0));

#//@function Calculates polynomial regression
Script polynomial_regression {
input src = hlc3;
input length = 100;
    def sumY = sum(src, length);
    def sumX = fold i = 0 to length with x do
               x + i;
    def sumXY = fold i1 = 0 to length with xy do
                xy + i1 * src[i1];
    def sumX2 = fold i2 = 0 to length with x2 do
                x2 + i2 * i2;
    def sumX3 = fold i3 = 0 to length with x3 do
                x3 + i3 * i3 * i3;
    def sumX4 = fold i4 = 0 to length with x4 do
                x4 + i4 * i4 * i4 * i4;
    def sumX2Y = fold i5 = 0 to length with x2y do
                x2y + i5 * i5 * src[i5];
    def slope = (length * sumXY - sumX * sumY) / (length * sumX2 - sumX * sumX);
    def intercept = (sumY - slope * sumX) / length;
    def polynomial_regression = slope + intercept;
    plot out = polynomial_regression;
}

#// Calculate basis using polynomial regression
def basis = polynomial_regression(src, length);
#// Calculate ATR and its SMA
def tr      = TrueRange(high(Period = tf), close(Period = tf), low(Period = tf));
def atr     = WildersAverage(tr, length);
def atr_sma = Average(atr, 10);

#// Calculate Keltner Channel Bands
def dynamicMultiplier  = (1 + (atr / atr_sma)) * multi;
def volatility_basis   = (1 + (atr / atr_sma)) * dynamicMultiplier * atr;

#// Set values for upper and lower bands
# // 4 bands above and below basis
def m0 = channelSensitivity;
def m1 = m0 + channelSensitivity;
def m2 = m1 + channelSensitivity;
def m3 = m2 + channelSensitivity;
def upper0 = basis + volatility_basis * m0;
def lower0 = basis - volatility_basis * m0;
def upper1 = basis + volatility_basis * m1;
def lower1 = basis - volatility_basis * m1;
def upper2 = basis + volatility_basis * m2;
def lower2 = basis - volatility_basis * m2;
def upper3 = basis + volatility_basis * m3;
def lower3 = basis - volatility_basis * m3;

#// Calculate Overbought/Oversold
def ob_os = (src - basis)/(upper3 - lower3);
def avgOBOS = Average(ob_os, 10);
#// Signal Conditions
def  trend  = basis > basis[2];
def  crossUp = (close Crosses Above lower3);
def  crossDn = (close Crosses Below upper3);

def col = if src > upper3 then 4 else
          if src > upper2 then 3 else
          if src > upper1 then 2 else
          if src > upper0 then 1 else
          if src < lower3 then -4 else
          if src < lower2 then -3 else
          if src < lower1 then -2 else
          if src < lower0 then -1 else 0;


AssignPriceColor(if !colorBars then Color.CURRENT else
                 if col== 4 then GlobalColor("up4") else
                 if col== 3 then GlobalColor("up3") else
                 if col== 2 then GlobalColor("up2") else
                 if col== 1 then GlobalColor("up1") else
                 if col==-4 then GlobalColor("dn4") else
                 if col==-3 then GlobalColor("dn3") else
                 if col==-2 then GlobalColor("dn2") else
                 if col==-1 then GlobalColor("dn1") else color.GRAY);
#// 𝙑𝙄𝙎𝙐𝘼𝙇𝙄𝙕𝘼𝙏𝙄𝙊𝙉
plot obSig = if crossDn then high else na;
plot osSig = if crossUp then low else na;
plot basisLine = if basis then basis else na;
obSig.SetDefaultColor(GetColor(0));
osSig.SetDefaultColor(GetColor(1));
obSig.setPaintingStrategy(PaintingStrategy.BOOLEAN_WEDGE_UP);
osSig.setPaintingStrategy(PaintingStrategy.BOOLEAN_WEDGE_DOWN);
basisLine.AssignValueColor(if trend then GetColor(1) else GetColor(0));

#// Plot upper and lower bands
plot up1 = if showChannel and trend then upper0 else na;
plot up2 = if showChannel and trend then upper1 else na;
plot up3 = if showChannel and trend then upper2 else na;
plot up4 = if showChannel and trend then upper3 else na;

plot lo1 = if !showChannel or trend then na else lower0;
plot lo2 = if !showChannel or trend then na else lower1;
plot lo3 = if !showChannel or trend then na else lower2;
plot lo4 = if !showChannel or trend then na else lower3;

up1.SetDefaultColor(GlobalColor("up1"));
up2.SetDefaultColor(GlobalColor("up2"));
up3.SetDefaultColor(GlobalColor("up3"));
up4.SetDefaultColor(GlobalColor("up4"));
lo1.SetDefaultColor(GlobalColor("dn1"));
lo2.SetDefaultColor(GlobalColor("dn2"));
lo3.SetDefaultColor(GlobalColor("dn3"));
lo4.SetDefaultColor(GlobalColor("dn4"));

#-- END of CODE