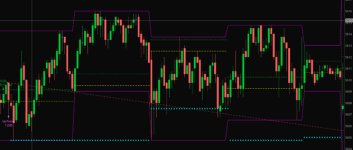
Hello - for a certain long futures strategy I have developed, I plot the previous high, low, and halfback at 30 minute aggregation on a 1 minute chart and open/close the position based on certain number of 1m closes above or below those levels. (For clarity, I'm plotting within my strategy, not in a separate study)So far so good the strategy itself works as desired. In real live trading, I will open/close the position manually and want to plot my stops which are based on 30 minutes levels on the same 1m chart. I am not having success in plotting my stops as desired. Below is the code I'm working with:
input AG = AggregationPeriod.THIRTY_MIN;
input LowBufferTicks = 6;
def Half = (high(period = AG)[1] + low(period = AG)[1]) / 2;
input StopPoints = 5;
def EntryPrice = EntryPrice();
def TickSize = TickSize();
def LX1 = EntryPrice - StopPoints;
def LX2 = low(period = AG)[1] - (LowBufferTicks * TickSize);
def MyStop = Max(LX1, LX2);
plot MyNewStop = if MyStop > EntryPrice + 5 then Half else max(MyStop, MyStop[1]);
MyNewStop.SetPaintingStrategy(PaintingStrategy.TRIANGLES);
MyNewStop.SetDefaultColor(Color.CYAN);
To articulate what I'm looking to do:
1. Until the close of the 30m timeframe of which I opened the position, I'm looking to plot the higher of either my entry price minus my stop loss, or the previous 30m low minus a buffer.
2. For the subsequent 30 minute periods for which the position is open, I want to plot the higher of either the new 30m period low minus a buffer or the previous plotted stop.
3. Looking to repeat step 2 until such time that step two is greater than my entry price + 5 points at which time, the stop plot should move to the halfback of the most recent previous 30m period.
Looking at the attached picture1, during the 4th 30m period the position was open, I wanted the cyan triangles to remain at the same level as the 3rd 30 minute period since that level is higher but the way I've currently coded and played with, does not net the desire result. Looking for any help and guidance and please forgive my coding if it's messy - I'm self taught and doing the best I can but appreciate pointers. Thank you!

