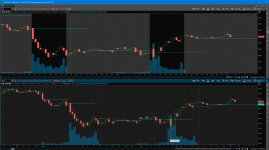
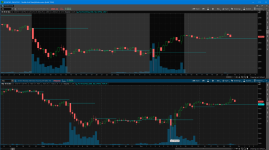
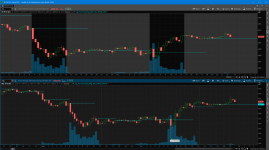
Getting the math right to plot price every N minutes is probably the hardest part about this indicator. The rest is pretty straightforward.
Here is an example with 12 hours (720 minutes) and 6 hours (360 minutes).

Code looks like this:
Link to the image/flex grid above
https://tos.mx/g8Btv1r
Happy trading,
Kory Gill, @korygill
Here is an example with 12 hours (720 minutes) and 6 hours (360 minutes).
Code looks like this:
Code:
#
# PlotTimeOfDay
#
# Author: Kory Gill, @korygill
# Paypal: paypal.me/korygill
#
declare upper;
declare once_per_bar;

input TimeOfDayEST = 930; # 24 hour time EST
input IntervalMinutes = 720; #hint IntervalMinutes: 12hr==720, 6hr==360
input Data = open;

def bn = BarNumber();
def nan = double.NaN;

def sft = SecondsFromTime(TimeOfDayEST);

def tt = if bn == 1
         then nan
         else if IsNaN(Data)
         then tt[1]
         else if sft % (IntervalMinutes*60) == 0
         then Data
         else tt[1];

plot TimeTracker = tt;
TimeTracker.SetPaintingStrategy(PaintingStrategy.HORIZONTAL);
Link to the image/flex grid above
https://tos.mx/g8Btv1r
Happy trading,
Kory Gill, @korygill


