I was wondering if someone could help make this thinkscript, its just drawing HORIZONTAL lines at the price high and price low of the highest volume bar within the last 240 bars as pictured below. I get tired of manually having to do this all the time. Much appreciation if someone can help with this. Example below.
I can get this far in finding the highest volume bar, but i don't know how to plot it with the price lines.

Edit: Found this by Mobius. High Volume Nodes (plots the high/low price of the highest volume bar within x bars).

I can get this far in finding the highest volume bar, but i don't know how to plot it with the price lines.
Code:
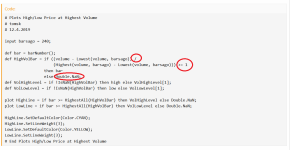
input barsago = 240;

def HighestVolume = Highest(volume, barsago);Edit: Found this by Mobius. High Volume Nodes (plots the high/low price of the highest volume bar within x bars).
Code:
# High Volume Nodes

# Mobius

# V01.02.2018

# Looks for the highest volume candle in "n" periods and plots the candle range.

# As Volatility increases this study has two values. Plotting a current high volume node as a channel which price will be drawn back to and test since a very high volume node will move price quickly, and price will retest that area. And, with the legacy plots a way to quickly see if larger traders, those that can generate a high volume node, are accumulating or distributing inventory.


input n = 20;

input LegacyPoints = yes;


def h = high;

def l = low;

def c = close;

def v = volume;

def x = barNumber();

def HighVolume = if ((v - Lowest(v, n)) / (Highest(v, n) - Lowest(v, n))) >= 1

                 then x

                 else Double.NaN;

def hh = if !IsNaN(HighVolume)

         then h

         else hh[1];

def ll = if !IsNaN(HighVolume)

         then l

         else ll[1];

plot hhLine = if x >= HighestAll(HighVolume)

              then HighestAll(if IsNaN(c)

                              then hh

                              else Double.NaN)

              else Double.NaN;

hhLine.SetDefaultColor(Color.GRAY);

plot llLine = if x >= HighestAll(HighVolume)

              then HighestAll(if IsNaN(c)

                              then ll

                              else Double.NaN)

              else Double.NaN;

llLine.SetDefaultColor(Color.GRAY);

plot legacy = if LegacyPoints and !IsNaN(HighVolume)

              then l - (2*TickSize())

              else Double.NaN;

legacy.SetStyle(Curve.POINTS);

legacy.SetLineWeight(3);

legacy.SetDefaultColor(Color.Gray);

AddCloud(llLine, hhLine, Color.GRAY, Color.GRAY);

# End Code High Volume Nodes
Last edited: