I am looking to code in horizontal lines which extend to the right from the bottom or top of a candle depending on an EMA crossover.
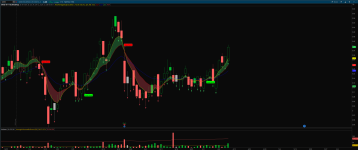
When price closes and a 5 and 10EMA cross has happened as well as a matching PSAR (above or below), then a bubble is added.
What I am looking for is replacing the bubbles in example 1 with horizontal lines.
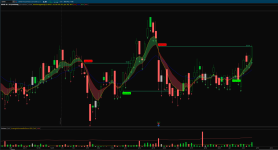
Ideally the lines would remain on the chart throughout history and only stop if price close above or below the line (example 2)
Here is how this has been made for reference,
When price closes and a 5 and 10EMA cross has happened as well as a matching PSAR (above or below), then a bubble is added.
What I am looking for is replacing the bubbles in example 1 with horizontal lines.
Ideally the lines would remain on the chart throughout history and only stop if price close above or below the line (example 2)
Here is how this has been made for reference,
Code:
Declare upper;
#Variables
input price = close;
input length1 = 5;
input length2 = 10;
input length3 = 20;
input accelerationFactor = 0.02;
input maxAccelerationFactor = 0.2;
input showBreakoutSignals = yes;

#EMA variables
def AvgExp1 = ExpAverage(price, length1);
def AvgExp2 = ExpAverage(price, length2);
def AvgExp3 = ExpAverage(price, length3);
plot EMA1 = ExpAverage(price, length1);
EMA1.SetDefaultColor(Color.YELLOW);
plot EMA2 = ExpAverage(price, length2);
EMA2.SetDefaultColor(Color.RED);
AddCloud(AvgExp1, AvgExp2, CreateColor(65, 210, 100), CreateColor(240, 75, 90));
plot EMA3 = ExpAverage(price, 20);
EMA3.SetDefaultColor(Color.BLUE);

#PSAR script
def psar = ParabolicSAR(accelerationFactor, maxAccelerationFactor);
def up = close > close[1];
def down = close < close[1];
def isAbovePSAR = close > psar;
def isBelowPSAR = close < psar;
plot PSARPlot = if isAbovePSAR then psar else Double.NaN;
PSARPlot.SetDefaultColor(CreateColor(65, 210, 100));
PSARPlot.SetPaintingStrategy(PaintingStrategy.boolean_ARROW_UP);
PSARPlot.SetLineWeight(2);
plot PSARPlotBelow = if isBelowPSAR then psar else Double.NaN;
PSARPlotBelow.SetDefaultColor(CreateColor(240, 75, 90));
PSARPlotBelow.SetPaintingStrategy(PaintingStrategy.boolean_ARROW_UP);
PSARPlotBelow.SetLineWeight(2);

#Signal
def UpSignal = AvgExp1 crosses above AvgExp2 and isAbovePSAR and up;
def DownSignal = AvgExp1 crosses below AvgExp2 and isBelowPSAR and down;
AddChartBubble(UpSignal, low, "Intial Stop", Color.GREEN, no);
AddChartBubble(DownSignal, high, "New Pivot", Color.RED, yes);