
Author Message:
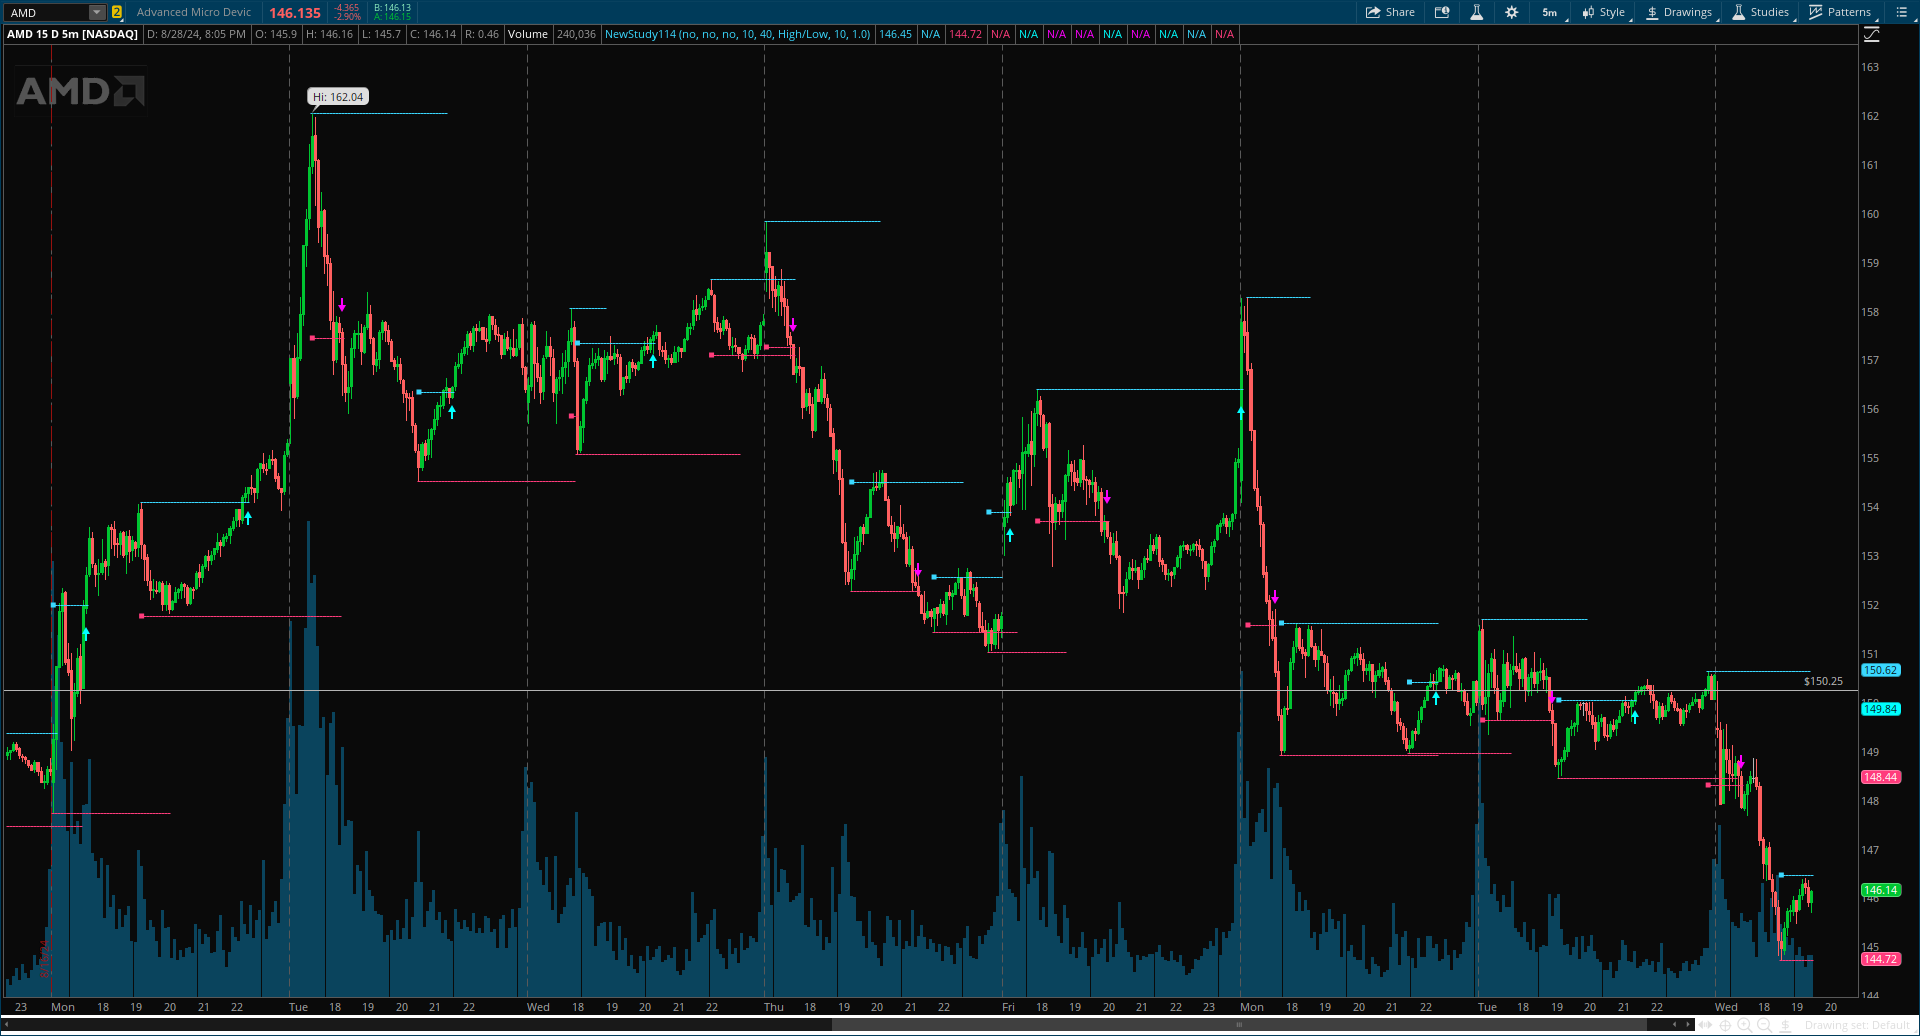
The Pivot Channel Break indicator identifies key pivot points and creates a dynamic channel based on these pivots. It detects breakouts from this channel, providing potential entry and exit signals for traders.
CODE:
CSS:
# Indicator for TOS
#// © BigBeluga
#indicator("Pivot Channel Breaks [BigBeluga]", overlay = true, max_lines_count = 20)
# Converted by Sam4Cok@Samer800    - 08/2024

input barColor    = no; #(false, "Bar Color")
input showRetest  = no; #, "Support & Resistance Signals")
input showPivotsLabels  = no;
input pivot_right = 10;
input pivot_left  = 40;
input trueRangeCalc = {Default "High/Low", "ATR"};
input trueRangeLength = 10;
input ChannelWidth = 1.0; #, "Channel Withd", step = 0.1)


def na = Double.NaN;
def last = IsNaN(close);
def HiLo = trueRangeCalc==trueRangeCalc."High/Low";
#-- Colors
DefineGlobalColor("up", CreateColor(58, 216, 255));
DefineGlobalColor("dn", CreateColor(255, 60, 124));
DefineGlobalColor("dup", CreateColor(26, 123, 130));
DefineGlobalColor("ddn", CreateColor(129, 27, 70));
#-- func
script Pivot {
    input series    = close;
    input leftBars  = 10;
    input rightBars = 10;
    input isHigh = yes;
    def na = Double.NaN;
    def HH = series == Highest(series, leftBars + 1);
    def LL = series == Lowest(series, leftBars + 1);
    def pivotRange = (leftBars + rightBars + 1);
    def leftEdgeValue = if series[pivotRange] == 0 then na else series[pivotRange];
    def pvtCond = !IsNaN(series) and leftBars > 0 and rightBars > 0 and !IsNaN(leftEdgeValue);
    def barIndexH = if pvtCond then
                    fold i = 1 to rightBars + 1 with p=1 while p do
                    series > GetValue(series, - i) else na;
    def barIndexL = if pvtCond then
                    fold j = 1 to rightBars + 1 with q=1 while q do
                    series < GetValue(series, - j) else na;
    def PivotPoint;
    if isHigh {
        PivotPoint = if HH and barIndexH then series else na;
    } else {
        PivotPoint = if LL and barIndexL then series else na;
    }
    plot pvt = PivotPoint;
}
#//# Calculations
#// Detect pivot points
def ph = pivot(high[pivot_right], pivot_left, pivot_right, yes);
def pl = pivot(low[pivot_right],  pivot_left, pivot_right, no);
def p_h = !IsNaN(ph);
def p_l = !IsNaN(pl);
#// Calculate channel bands
def basis = Average(close, trueRangeLength);
def tr  = if HiLo then (high - low) else TrueRange(high, close, low);
def uppper_dev = basis + WildersAverage(tr, trueRangeLength) * ChannelWidth;
def lower_dev  = basis - WildersAverage(tr, trueRangeLength) * ChannelWidth;

#// Set channel points based on pivot highs and lows
def point_l;
def point_h;
if p_h {
    point_l = lower_dev;
    point_h = high[pivot_right];
} else if p_l {
    point_l = low[pivot_right];
    point_h = uppper_dev;
} else {
    point_l = point_l[1];
    point_h = point_h[1];
}
#// Draw channel lines and labels
def cond =  p_h[-pivot_right] or p_l[-pivot_right];
def StateL1 = {default "ini", "1"};
def line1;
def line11;
def cnt1;

Switch (StateL1[1]) {
Case "1" :
        StateL1 = StateL1[1];
    if cond {
        cnt1 = 0;
        line11  = line1[1];
        line1   = point_h[-pivot_right];
    } else {
        cnt1 = cnt1[1] + 1;
        line1   = if low > line1[1] then na else line1[1];
        line11  = if low > line11[1] then na else if cnt1 >= pivot_right then na else line11[1];
    }
Default :
    cnt1    = 0;
    StateL1 = StateL1."1";
    line1   = na;
    line11  = na;
}
#-- Pvt Low Lines
def StateL2 = {default "ini", "1"};
def line2;
def line22;
def cnt2;
Switch (StateL2[1]) {
Case "1" :
        StateL2 = StateL2[1];
    if cond {
        cnt2 = 0;
        line22  = line2[1];
        line2   = point_l[-pivot_right];
    } else {
        cnt2 = cnt2[1] + 1;
        line22 = if high < line22[1] then na else if cnt2 >= pivot_right then na else line22[1];
        line2  = if high < line2[1] then na else line2[1];
    }
Default :
    cnt2    = 0;
    StateL2 = StateL2."1";
    line22  = na;
    line2   = na;
}

#// Detect breakouts
def break_up = (low Crosses Above point_h[-pivot_right]);
def break_dn = (high crosses below point_l[-pivot_right]);
def breakUp = (low Crosses Above point_h);
def breakDn = (high crosses below point_l);
#// Set trend color based on breakouts
def trend_col;
if breakUp {
    trend_col = 1;
} else if breakDn {
    trend_col = -1;
} else {
    trend_col = trend_col[1];
}

#// Detect and plot support and resistance signals
def resist  = (high crosses below line1) and !break_dn and !p_h[-pivot_right+1] and showRetest;
def support = (low crosses above line2)  and !break_up and !p_l[-pivot_right+1] and showRetest;
def resist1  = (high crosses below line11) and !break_dn and !p_h[-pivot_right+1] and showRetest;
def support1 = (low crosses above line22)  and !break_up and !p_l[-pivot_right+1] and showRetest;

#-- plot
plot pvtHiLine  = if line1  then line1  else na;
plot pvtHiLine1 = if line11 then line11 else na;
plot pvtLoLine  = if line2  then line2  else na;
plot pvtLoLine1 = if line22 then line22 else na;
pvtHiLine.SetPaintingStrategy(PaintingStrategy.HORIZONTAL);
pvtLoLine.SetPaintingStrategy(PaintingStrategy.HORIZONTAL);
pvtHiLine1.SetPaintingStrategy(PaintingStrategy.HORIZONTAL);
pvtLoLine1.SetPaintingStrategy(PaintingStrategy.HORIZONTAL);
pvtHiLine.SetDefaultColor(GlobalColor("up"));
pvtHiLine1.SetDefaultColor(GlobalColor("up"));
pvtLoLine.SetDefaultColor(GlobalColor("dn"));
pvtLoLine1.SetDefaultColor(GlobalColor("dn"));
# // Plot breakout signals
plot breakRes = if break_up[-1] then line1-atr(14)/2 else na;
plot breakSup = if break_dn[-1] then line2+atr(14)/2 else na;
breakRes.SetPaintingStrategy(PaintingStrategy.ARROW_UP);
breakSup.SetPaintingStrategy(PaintingStrategy.ARROW_DOWN);
breakRes.SetDefaultColor(Color.CYAN);
breakSup.SetDefaultColor(Color.MAGENTA);
#/ Plot pivot high and low points
plot resSig = if resist[-1] then high else na;
plot supSig = if support[-1] then low else na;
plot resSig1 = if resist1[-1] then high else na;
plot supSig1 = if support1[-1] then low else na;
resSig.SetLineWeight(2);
resSig.SetDefaultColor(Color.MAGENTA);
resSig.SetPaintingStrategy(PaintingStrategy.BOOLEAN_WEDGE_UP);
supSig.SetLineWeight(2);
supSig.SetDefaultColor(Color.CYAN);
supSig.SetPaintingStrategy(PaintingStrategy.BOOLEAN_WEDGE_DOWN);
resSig1.SetLineWeight(2);
resSig1.SetDefaultColor(Color.MAGENTA);
resSig1.SetPaintingStrategy(PaintingStrategy.BOOLEAN_WEDGE_UP);
supSig1.SetLineWeight(2);
supSig1.SetDefaultColor(Color.CYAN);
supSig1.SetPaintingStrategy(PaintingStrategy.BOOLEAN_WEDGE_DOWN);
#// Plot channel points
plot dtUp = if p_l[-pivot_right] then point_h[-pivot_right] else na;
plot dtDn = if p_h[-pivot_right] then point_l[-pivot_right] else na;
dtUp.SetLineWeight(2);
dtDn.SetLineWeight(2);
dtUp.SetPaintingStrategy(PaintingStrategy.SQUARES);
dtDn.SetPaintingStrategy(PaintingStrategy.SQUARES);
dtUp.SetDefaultColor(GlobalColor("up"));
dtDn.SetDefaultColor(GlobalColor("dn"));
#-- Bubbles

def ph_1 = if p_h then ph else ph_1[1];
def pl_1 = if p_l then pl else pl_1[1];
def hh = if p_h and ph > ph_1[1] then ph else na;
def ll = if p_l and pl < pl_1[1] then pl else na;
def hl = if pl_1 > pl_1[1] then pl_1 else na;
def lh = if ph_1 < ph_1[1] then ph_1 else na;

AddChartBubble(showPivotsLabels and hh[-pivot_right], hh[-pivot_right] , "HH", Color.GREEN);
AddChartBubble(showPivotsLabels and ll[-pivot_right], ll[-pivot_right] , "LL", Color.RED, no);
AddChartBubble(showPivotsLabels and lh[-pivot_right], lh[-pivot_right] , "LH", Color.DARK_GREEN);
AddChartBubble(showPivotsLabels and hl[-pivot_right], hl[-pivot_right] , "HL", Color.DARK_RED, no);


#-- bar color

AssignPriceColor( if !barColor then Color.CURRENT else
                  if trend_col > 0 then GlobalColor("dup") else
                  if trend_col < 0 then GlobalColor("ddn") else Color.DARK_GRAY);

#-- END of CODE