Darth Tradicus
Member
Hello, I guess this is a fairly basic/dumb mechanics question that I'm having trouble figuring out...
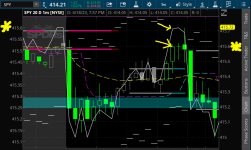
I have a line chart of SPY overlayed over a HeikinAshi Candle chart of SPY through the comparison feature in edit studies.
Mainly wanted to overlay the line so that I could quickly see exactly where price was closing at every heikin ashi candle. Problem though, the price levels on the left of the chart for the SPY line don't align with the price levels on the right side for the candles- so the line is off. I can click and drag on the price level to pull the line toward where the candle close is, but then scrolling left to right, the chart no longer fits to screen.
Is there any way around this, to get the line overlay but with price aligning on the left and right? Or perhaps an overlay indicator that does? Guess I really just need a line to connect the close of each candle...
18427[/ATTACH]']

