
Hello,
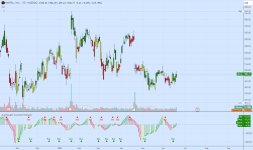
There is a pine script by Ceyhun "Overbought Oversold Indicator on TradingView" I have searched this forum and many others for a compatible working version
for ThinkorSwim. To no avail, I was not able to find anything similar to this script from TradingView.
Any help in converting this pine script code to Thinkscript is greatly appreciated. In advance...Thank you !!!
Here is the link to his script: https://www.tradingview.com/script/RLoA9E77/
and the link to the image : https://www.tradingview.com/i/RLoA9E77/
================
Attachments
Last edited by a moderator: