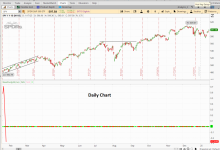
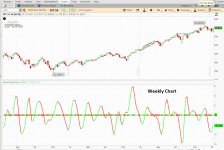
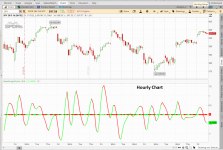
This indicator implements the Optimum Predictor Indicator from Dr Ehler's book, "Rocket Science for Traders" in thinkscript and is provided for educational purposes.

The indicator implements Dr Ehler's algorithm which adds phasors of the smoothed and detrended price data and applies the Homodyne Discriminator to the result, returning the price cycle period (eg time to complete a full cycle).
The price cycle period is then refined via more detrending and EMA smoothing per the algorithm in Dr Ehler's book. The predictor line is plotted on the lower chart.
The algorithm is supplemented by computing the slope of the predictor line using a 2nd order accurate finite difference expression. The predictor line is colored green when its slope > 0 and red when its slope < 0.
To block false signals, the slope of the price is used to color the zero line green when the price slope > 0 and red when it is < 0. If the predictor line is sloping up when the price is sloping up (eg both lines are green) the back tester goes long. When both lines are red, the back tester exits any long position and goes short.
Here is an upper indicator that implements the Optimum Predictor Indicator. It plots and HMA(HL2) with period 5 and colors the line green when the price and Optimum Predictor Indicator are both green, and red when they are both red.
mod note: also check out:
SineWave Indicator
https://usethinkscript.com/threads/sinewave-indicator-for-thinkorswim.20179/
The indicator implements Dr Ehler's algorithm which adds phasors of the smoothed and detrended price data and applies the Homodyne Discriminator to the result, returning the price cycle period (eg time to complete a full cycle).
The price cycle period is then refined via more detrending and EMA smoothing per the algorithm in Dr Ehler's book. The predictor line is plotted on the lower chart.
The algorithm is supplemented by computing the slope of the predictor line using a 2nd order accurate finite difference expression. The predictor line is colored green when its slope > 0 and red when its slope < 0.
To block false signals, the slope of the price is used to color the zero line green when the price slope > 0 and red when it is < 0. If the predictor line is sloping up when the price is sloping up (eg both lines are green) the back tester goes long. When both lines are red, the back tester exits any long position and goes short.
Here is an upper indicator that implements the Optimum Predictor Indicator. It plots and HMA(HL2) with period 5 and colors the line green when the price and Optimum Predictor Indicator are both green, and red when they are both red.
CSS:
# Optimum Predictor Indicator Upper
# From Figure 20.2 of Rocket Science for Traders, by Dr Ehler
# Implemented in thinkscript by [email protected]    - 12/2024

declare upper;

input showSmoother = no;

script GetPeriod {
    input Period_Prev_Bar = 6;
    def Price = HL2;
    def Smooth = (4 * Price + 3 * Price[1] + 2 * Price[2] + Price[3]) / 10;

    def Detrender = (0.0962 * Smooth + 0.5769 * Smooth[2] - 0.5769 * Smooth[4] - 0.0962 * Smooth[6]) * (0.075 * Period_Prev_Bar + 0.54);

    def Q1 = (0.0962 * Detrender + 0.5769 * Detrender[2] - 0.5769 * Detrender[4] - 0.0962 * Detrender[6]) * (0.075 * Period_Prev_Bar + 0.54);
    def I1 = Detrender[3];

    # Advance the phase of I1 and Q1 by 90 degrees
    def jI = (0.0962 * I1 + 0.5769 * I1[2] - 0.5769 * I1[4] - 0.0962 * I1[6]) * (0.075 * Period_Prev_Bar + 0.54);
    def jQ = (0.0962 * Q1 + 0.5769 * Q1[2] - 0.5769 * Q1[4] - 0.0962 * Q1[6]) * (0.075 * Period_Prev_Bar + 0.54);

    # Phasor addition for 3 bar averaging
    def I2 = I1 - jQ;
    def Q2 = Q1 + jI;

    # Smooth the I and Q components before applying the discriminator
    def I2smooth = 0.2 * I2 + 0.8 * I2[1];
    def Q2smooth = 0.2 * Q2 + 0.8 * Q2[1];

    # Homodyne Discriminator
    def Re = I2smooth * I2smooth[1] + Q2smooth * Q2smooth[1];
    def Im = I2smooth * Q2smooth[1] + Q2smooth * I2smooth[1];

    def Resmooth = 0.2 * Re + 0.8 * Re[1];
    def Imsmooth = 0.2 * Im + 0.8 * Im[1];

    def P = if Imsmooth <> 0 and Resmooth <> 0 and 360.0 / ATan(Imsmooth / Resmooth) < 1.5 * Period_Prev_Bar and 360.0 / ATan(Imsmooth / Resmooth) > 0.67 * Period_Prev_Bar then 360.0 / ATan(Imsmooth / Resmooth) else if 360.0 / ATan(Imsmooth / Resmooth) > 1.5 * Period_Prev_Bar then 1.5 * Period_Prev_Bar else if 360.0 / ATan(Imsmooth / Resmooth) < 0.67 * Period_Prev_Bar then 0.67 * Period_Prev_Bar else if 360.0 / ATan(Imsmooth / Resmooth) < 6 then 6 else if 360.0 / ATan(Imsmooth / Resmooth) > 50 then 50 else 6;


    def Psmooth = 0.2 * P + 0.8 * P[1];
    def Psmoothed_twice = 0.33 * Psmooth + 0.67 * Psmoothed_twice[1];

    plot Period_smoothed = Psmoothed_twice; #returns the newly computed smoothed period value
    Period_smoothed.Hide();

}# end Script GetPeriod()


def Period_ = CompoundValue(4,
                          if BarNumber() > 5 then GetPeriod(Period_[1]) else Period_[1],
                          6);

def S = GetPeriod(Period_[1]).Smooth;
def Detrender2 = 0.5 * S - 0.5 * S[2];
def S2 = (4 * Detrender2 + 3 * Detrender2[1] + 2 * Detrender2[2] + Detrender2[3]) / 10;
def alpha = 1 - Exp(-6.28 / Period_);
def DetrendEMA = alpha * S2 + (1 - alpha) * DetrendEMA[1];

def Predict = 1.4 * (S2 - DetrendEMA);

def Predictor = Predict;
def PredictorSlope =  0.500 * (3.00 * Predictor - 4.00 * Predictor[1] + Predictor[2]);

#Predictor.AssignValueColor(if PredictorSlope > 0 then Color.GREEN else Color.RED);

def price = close;
def priceSlope =  0.500 * (3.00 * price - 4.00 * price[1] + price[2]);

input HMAlength = 5;
input displace = 0;

plot HMA = MovingAverage(AverageType.HULL, price, HMAlength)[-displace];
HMA.SetLineWeight(5);

def PLBuySignal = if PredictorSlope > 0 and priceSlope > 0 then 1 else 0;
def PLSellSignal =  if PredictorSlope < 0 and priceSlope < 0 then 1 else 0;

#######################################
##  Maintain the position of trades
#######################################

def CurrentPosition;  # holds whether flat = 0 long = 1 short = -1

if (BarNumber() == 1) or IsNaN(CurrentPosition[1]) {
    CurrentPosition = 0;
} else {
    if CurrentPosition[1] == 0 {            # FLAT
        if (PLBuySignal) {
            CurrentPosition = 1;
        } else if (PLSellSignal) {
            CurrentPosition = -1;
        } else {
            CurrentPosition = CurrentPosition[1];
        }
    } else if CurrentPosition[1] == 1 {      # LONG
        if (PLSellSignal) {
            CurrentPosition = -1;
        } else if ((PLSellSignal)) {
            CurrentPosition = 0;
        } else {
            CurrentPosition = CurrentPosition[1];
        }
    } else if CurrentPosition[1] == -1 {     # SHORT
        if (PLBuySignal) {
            CurrentPosition = 1;
        } else if ((PLBuySignal)) {
            CurrentPosition = 0;
        } else {
            CurrentPosition = CurrentPosition[1];
        }
    } else {
        CurrentPosition = CurrentPosition[1];
    }
}

def isLong  = if CurrentPosition == 1 then 1 else 0;
def isShort = if CurrentPosition == -1 then 1 else 0;
def isFlat  = if CurrentPosition == 0 then 1 else 0;

HMA.AssignValueColor(if isLong then Color.DARK_GREEN else if isShort then Color.DARK_RED else Color.CURRENT);
HMA.SetLineWeight(5);

HMA.AssignValueColor(if isLong then Color.GREEN else if isShort then Color.RED else Color.CURRENT);

#END UPPER
CSS:
# Optimum Predictor Indicator LOWER
# From Figure 20.2 of Rocket Science for Traders, by Dr Ehler
# Implemented in thinkscript by [email protected]    - 12/2024

declare lower;

input showSmoother = no;


script GetPeriod {
    input Period_Prev_Bar = 6;
    def Price = HL2;
    def Smooth = (4 * Price + 3 * Price[1] + 2 * Price[2] + Price[3]) / 10;

    def Detrender = (0.0962 * Smooth + 0.5769 * Smooth[2] - 0.5769 * Smooth[4] - 0.0962 * Smooth[6]) * (0.075 * Period_Prev_Bar + 0.54);

    def Q1 = (0.0962 * Detrender + 0.5769 * Detrender[2] - 0.5769 * Detrender[4] - 0.0962 * Detrender[6]) * (0.075 * Period_Prev_Bar + 0.54);
    def I1 = Detrender[3];

    # Advance the phase of I1 and Q1 by 90 degrees
    def jI = (0.0962 * I1 + 0.5769 * I1[2] - 0.5769 * I1[4] - 0.0962 * I1[6]) * (0.075 * Period_Prev_Bar + 0.54);
    def jQ = (0.0962 * Q1 + 0.5769 * Q1[2] - 0.5769 * Q1[4] - 0.0962 * Q1[6]) * (0.075 * Period_Prev_Bar + 0.54);

    # Phasor addition for 3 bar averaging
    def I2 = I1 - jQ;
    def Q2 = Q1 + jI;

    # Smooth the I and Q components before applying the discriminator
    def I2smooth = 0.2 * I2 + 0.8 * I2[1];
    def Q2smooth = 0.2 * Q2 + 0.8 * Q2[1];

    # Homodyne Discriminator
    def Re = I2smooth * I2smooth[1] + Q2smooth * Q2smooth[1];
    def Im = I2smooth * Q2smooth[1] + Q2smooth * I2smooth[1];

    def Resmooth = 0.2 * Re + 0.8 * Re[1];
    def Imsmooth = 0.2 * Im + 0.8 * Im[1];

    def P = if Imsmooth <> 0 and Resmooth <> 0 and 360.0 / ATan(Imsmooth / Resmooth) < 1.5 * Period_Prev_Bar and 360.0 / ATan(Imsmooth / Resmooth) > 0.67 * Period_Prev_Bar then 360.0 / ATan(Imsmooth / Resmooth) else if 360.0 / ATan(Imsmooth / Resmooth) > 1.5 * Period_Prev_Bar then 1.5 * Period_Prev_Bar else if 360.0 / ATan(Imsmooth / Resmooth) < 0.67 * Period_Prev_Bar then 0.67 * Period_Prev_Bar else if 360.0 / ATan(Imsmooth / Resmooth) < 6 then 6 else if 360.0 / ATan(Imsmooth / Resmooth) > 50 then 50 else 6;


    def Psmooth = 0.2 * P + 0.8 * P[1];
    def Psmoothed_twice = 0.33 * Psmooth + 0.67 * Psmoothed_twice[1];

    plot Period_smoothed = Psmoothed_twice; #returns the newly computed smoothed period value
    Period_smoothed.Hide();

}# end Script GetPeriod()


def Period_ = CompoundValue(4,
                          if BarNumber() > 5 then GetPeriod(Period_[1]) else Period_[1],
                          6);

def S = GetPeriod(Period_[1]).Smooth;
def Detrender2 = 0.5 * S - 0.5 * S[2];
def S2 = (4 * Detrender2 + 3 * Detrender2[1] + 2 * Detrender2[2] + Detrender2[3]) / 10;
def alpha = 1 - Exp(-6.28 / Period_);
def DetrendEMA = alpha * S2 + (1 - alpha) * DetrendEMA[1];

def Predict = 1.4 * (S2 - DetrendEMA);

plot Smooth2 = if showSmoother then S2 else Double.NaN;
plot Predictor = Predict;

Predictor.SetLineWeight(2);

def PredictorSlope =  0.500 * (3.00 * Predictor - 4.00 * Predictor[1] + Predictor[2]);

#Predictor.AssignValueColor(if PredictorSlope > 0 and PredictorSlope - PredictorSlope[1] > 0 then Color.GREEN else if PredictorSlope > 0 and PredictorSlope - PredictorSlope[1] < 0 then Color.LIGHT_GREEN else if PredictorSlope < 0 and PredictorSlope - PredictorSlope[1] < 0 then Color.RED else if PredictorSlope < 0 and PredictorSlope - PredictorSlope[1] > 0 then Color.LIGHT_RED else Color.CYAN);

Predictor.AssignValueColor(if PredictorSlope > 0 then Color.GREEN else Color.RED);

def price = close;
def priceSlope =  0.500 * (3.00 * price - 4.00 * price[1] + price[2]);

plot priceConfluence = 0;
priceConfluence.AssignValueColor(if priceSlope > 0 and priceSlope - priceSlope[1] > 0 then Color.GREEN else if priceSlope > 0 and priceSlope - priceSlope[1] < 0 then Color.LIGHT_GREEN else if priceSlope < 0 and priceSlope - priceSlope[1] < 0 then Color.RED else if priceSlope < 0 and priceSlope - priceSlope[1] > 0 then Color.LIGHT_RED else Color.CYAN);

priceConfluence.SetLineWeight(5);
Last edited:


