The following is a script that gives me the volatility based on highest and lowest close regardless of candle color. works perfect. I would like to have it work on my watchlist but instead of displaying the percentages I need it to be green if above 5 percent.
input lookback = 4;
def hoc = Max(Highest(open, lookback), Highest(close, lookback));
def loc = Min(Lowest (open, lookback), Lowest (close, lookback));
def "vol_w/o" = AbsValue(hoc[1] - loc[1]) / loc[1];
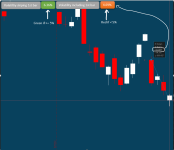
AddLabel(1, "Volatility 6:30-10am " + AsPercent("vol_w/o") , if "vol_w/o" * 100 > 5 then Color.GREEN else Color.RED);
def "vol_w" = AbsValue(hoc - loc) / loc;
AddLabel(1, "Volatility 10am-1pm " + AsPercent("vol_w") , if "vol_w" * 100 > 5 then Color.GREEN else Color.RED);
input test = no;
AddLabel(test, " Highest w " + hoc + " Lowest w " + loc + " || Highest skipping " + hoc[1] + " Lowest skipping 1st " + loc[1] , Color.WHITE);