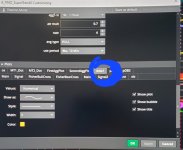
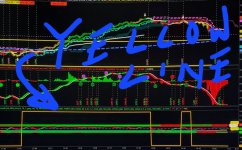
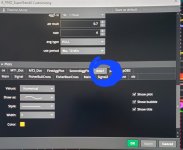
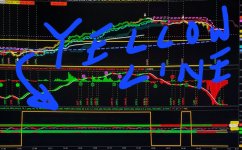
I would like the Data1 yellow line to be closer to the 25 plus and minus.
Could someone please tell me what the Data1 is in the below script?
Thank you.
Could someone please tell me what the Data1 is in the below script?
I am actually looking to just use whatever the Data1 is by itself can someone please isolate it for me?def sState1 = if HAclose > HAopen then 100 else -100;
plot data1 = sState1
Thank you.
Code:
#MTF True Momentum Oscillator MTF Trend Magic and MTF ATR SuperTrend
#combined enhancements by HighBredCloud
#V12.14.2019

# filename: MR__EZ_TMO_MTF_Fisher_2Agg_
# source: https://usethinkscript.com/d/91-tmo-with-higher-agg-mobius-tsl

# TMO ((T)rue (M)omentum (O)scillator) With Higher Aggregation
# Mobius
# V01.05.2018
#hint: TMO calculates momentum using the DELTA of price. Giving a much better picture of trend, trend reversals and divergence than momentum oscillators using price.

declare lower;

input length = 14; # default -> 14;
def calcLength = 5;
def smoothLength = 3;
input aggA = AggregationPeriod.FIVE_MIN;

def o = open(period = aggA);
def c = close(period = aggA);
def data = fold i = 0 to length
with s
do s + (if c > GetValue(o, i)
then 1
else if c < GetValue(o, i)
then - 1
else 0);
def EMA5 = ExpAverage(data, calcLength);
plot Main = ExpAverage(EMA5, smoothLength);
plot Signal = ExpAverage(Main, smoothLength);
Main.AssignValueColor(if Main > Signal
then Color.GREEN
else Color.RED);
Signal.AssignValueColor(if Main > Signal
then Color.GREEN
else Color.RED);
Main.SetLineWeight(1);
Signal.SetLineWeight(1);
Signal.HideBubble();
Signal.HideTitle();


# JQ_FisherTransform_wLabels v02
# assistance provided by AlphaInvestor, amalia, randyr and nube

# v02 9.23.2018 JQ added arrows

input Fisherprice = hl2;
input FisherLength = 10;
input TriggerLineOffset = 1; # Ehler's value of choice is 1
input TriggerLine_Color_Choice = {"magenta", "cyan", "pink", default "gray", "Mustard", "red", "green", "dark_gray", "Pale Yellow", "white"};
input deBug = no;

def maxHigh = Highest(Fisherprice, FisherLength);
def minLow = Lowest(Fisherprice, FisherLength);
def range = maxHigh - minLow;
def value = if IsNaN(Fisherprice)
then Double.NaN
else if IsNaN(range)
then value[1]
else if range == 0
then 0
else 0.66 * ((Fisherprice - minLow) / range - 0.5) + 0.67 * value[1];
def truncValue = if value > 0.99 then 0.999 else if value < -0.99 then -0.999 else value;
def fish = 0.5 * (Log((1 + truncValue) / (1 - truncValue)) + fish[1]);
def FTOneBarBack = fish[TriggerLineOffset];
def FT = fish;

plot FisherBullCross = if FT crosses above FTOneBarBack then LowestAll(Main) else Double.NaN;
FisherBullCross.SetPaintingStrategy(PaintingStrategy.ARROW_UP);
FisherBullCross.SetDefaultColor(Color.WHITE);

plot FisherBearCross = if FT crosses below FTOneBarBack then HighestAll(Main) else Double.NaN;
FisherBearCross.SetPaintingStrategy(PaintingStrategy.ARROW_DOWN);
FisherBearCross.SetDefaultColor(Color.WHITE);


input length2 = 14; # default -> 14;
def calcLength2 = 5;
def smoothLength2 = 3;
input aggB = AggregationPeriod.FIFTEEN_MIN;

def o2 = open(period = aggB);
def c2AA = close(period = aggB);
def data2 = fold i2 = 0 to length2
with s2
do s2 + (if c2AA > GetValue(o2, i2)
then 1
else if c2AA < GetValue(o2, i2)
then - 1
else 0);
def EMA52 = ExpAverage(data2, calcLength2);
plot Main2 = ExpAverage(EMA52, smoothLength2);
plot Signal2 = ExpAverage(Main2, smoothLength2);
Main2.AssignValueColor(if Main2 > Signal2
then Color.UPTICK
else Color.DOWNTICK);
Signal2.AssignValueColor(if Main2 > Signal2
then Color.UPTICK
else Color.DOWNTICK);
Signal2.HideBubble();
Signal2.HideTitle();

AddCloud(Main, Signal, Color.GREEN, Color.RED);
AddCloud(Main2, Signal2, Color.UPTICK, Color.DOWNTICK);

plot ZeroLine = 0;
ZeroLine.SetDefaultColor(Color.MAGENTA);
ZeroLine.HideBubble();
ZeroLine.HideTitle();

plot ob = if IsNaN(c) then Double.NaN else Round(length * .7);
ob.SetDefaultColor(Color.DARK_ORANGE);
ob.HideBubble();
ob.HideTitle();
plot os = if IsNaN(c) then Double.NaN else -Round(length * .7);
os.SetDefaultColor(Color.CYAN);
os.HideBubble();
os.HideTitle();
AddCloud(ob, length, Color.DARK_ORANGE, Color.DARK_ORANGE, no);
AddCloud(-length, os, Color.CYAN, Color.CYAN);
#
# Trend Magic MTF
# tomsk
# 11.26.2019

# V1.0 - 08.08.2019 - Horserider - Added MTF to Trend Magic
# V1.1 - 11.26.2019 - tomsk - Optimized code structure, removed duplicate variables
# V1.2 - 11.26.2019 - tomsk - Converted this study to a lower study with MTF triangles

#declare lower;

# GLOBAL DEFINITIONS

DefineGlobalColor("TrendUp", CreateColor(0, 254, 30));
DefineGlobalColor("TrendDown", CreateColor(255, 3, 2));

input agg1TM = AggregationPeriod.FIFTEEN_MIN;
input agg2TM = AggregationPeriod.THIRTY_MIN;
input agg3TM = AggregationPeriod.HOUR;

input lengthCCI = 50;
input lengthATR = 5;
input AtrFactor = 0.7;

input DotSize = 3;
input n = 3;

def n1 = n + 1;

# AGGREGATION 1

def c1A = close(period = agg1TM);
def h1A = high(period = agg1TM);
def l1A = low(period = agg1TM);
def pricedata1A = hl2(period = agg1TM);
def ATRcci1A = Average(TrueRange(h1A, c1A, l1A), lengthATR) * AtrFactor;
def price1A = c1A + l1A + h1A;
def linDev1A = LinDev(price1A, lengthCCI);
def CCI1A = if linDev1A == 0 then 0 else (price1A - Average(price1A, lengthCCI)) / linDev1A / 0.015;
def MT1 = if CCI1A > 0
then Max(MT1[1], pricedata1A - ATRcci1A)
else Min(MT1[1], pricedata1A + ATRcci1A);
plot MT1_Dot = if IsNaN(close) then Double.NaN else -17;
MT1_Dot.SetPaintingStrategy(PaintingStrategy.TRIANGLES);
MT1_Dot.SetLineWeight(DotSize);
MT1_Dot.AssignValueColor(if c1A < MT1 then GlobalColor("TrendDown") else GlobalColor("TrendUp"));
AddChartBubble(!IsNaN(close[n1]) and IsNaN(close[n]), -17, (agg1TM / 1000 / 60) + " min", Color.YELLOW, yes);

# AGGREGATION 2

def c2A = close(period = agg2TM);
def h2A = high(period = agg2TM);
def l2A = low(period = agg2TM);
def pricedata2A = hl2(period = agg2TM);
def ATRcci2A = Average(TrueRange(h2A, c2A, l2A), lengthATR) * AtrFactor;
def price2A = c2A + l2A + h2A;
def linDev2A = LinDev(price2A, lengthCCI);
def CCI2A = if linDev2A == 0 then 0 else (price2A - Average(price2A, lengthCCI)) / linDev2A / 0.015;
def MT2 = if CCI2A > 0
then Max(MT2[1], pricedata2A - ATRcci2A)
else Min(MT2[1], pricedata2A + ATRcci2A);
plot MT2_Dot = if IsNaN(close) then Double.NaN else 17;
MT2_Dot.SetPaintingStrategy(PaintingStrategy.TRIANGLES);
MT2_Dot.SetLineWeight(DotSize);
MT2_Dot.AssignValueColor(if c2A < MT2 then GlobalColor("TrendDown") else GlobalColor("TrendUp"));
AddChartBubble(!IsNaN(close[n1]) and IsNaN(close[n]), 17, (agg2TM / 1000 / 60) + " min", Color.YELLOW, yes);

# AGGREGATION 3

#def c3A = close(period = agg3TM);
#def h3A = high(period = agg3TM);
#def l3A = low(period = agg3TM);
#def pricedata3A = hl2(period = agg3TM);

#def ATRcci3A = Average(TrueRange(h3A, c3A, l3A), lengthATR) * AtrFactor;
#def price3A = c3A + l3A + h3A;
#def linDev3A = LinDev(price3A, lengthCCI);
#def CCI3A = if linDev3A == 0 then 0 else (price3A - Average(price3A, lengthCCI)) / linDev3A / 0.015;
#def MT3 = if CCI3A > 0
#then Max(MT3[1], pricedata3A - ATRcci3A)
#else Min(MT3[1], pricedata3A + ATRcci3A);
#plot MT3_Dot = if IsNaN(close) then Double.NaN else -23;
#MT3_Dot.SetPaintingStrategy(PaintingStrategy.TRIANGLES);
#MT3_Dot.SetLineWeight(DotSize);
#MT3_Dot.AssignValueColor(if c3A < MT3 then GlobalColor("TrendDown") else GlobalColor("TrendUp"));
#AddChartBubble(!IsNaN(close[n1]) and IsNaN(close[n]), -23, (agg3TM / 1000 / 60) + " min", Color.YELLOW, yes);
# End Trend Magic MTF
#
# SuperTrend Multiple Time Frames
# Mobius with mods by tomsk to replace the script() function for secondary aggs with "standard" code
# V03.01.2016
# 11.4.2019

#declare lower;

input agg1ST = AggregationPeriod.Five_Min;
input agg2ST = AggregationPeriod.Ten_Min;
input agg3ST = AggregationPeriod.Fifteen_Min;
input agg4ST = AggregationPeriod.Thirty_Min;
input agg5ST = AggregationPeriod.Hour;
input AtrMult = .70;
input nATR = 4;
input AvgType = AverageType.HULL;

def Fh = FundamentalType.High;
def Fl = FundamentalType.Low;
def Fc = FundamentalType.Close;
def Fhl2 = FundamentalType.HL2;

def cl = close;
def x = isNaN(cl[2]) and !isNaN(cl[3]);
def ATR = MovingAverage(AvgType, TrueRange(high, close, low), nATR);
def UP = hl2 + (AtrMult * ATR);
def DN = hl2 + (-AtrMult * ATR);
def S1A = if close < S1A[1]
then Round(UP / tickSize(), 0) * tickSize()
else Round(DN / tickSize(), 0) * tickSize();
def FirstAgg = if close > S1A then 1 else 0;
plot FirstAggPlot = if isNaN(cl)
then double.nan
else -21;
FirstAggPlot.SetStyle(Curve.Points);
FirstAggPlot.SetLineWeight(3);
FirstAggPlot.AssignValueColor(if FirstAgg == 1
then color.green
else color.red);
AddChartBubble(x, 1, (GetAggregationPeriod()/1000/60) + " min", color.white, yes);

# SecondAgg
def h2 = Fundamental(Fh, period = agg2ST)[1];
def l2 = Fundamental(Fl, period = agg2ST)[1];
def c2 = Fundamental(Fc, period = agg2ST)[1];
def hl2 = Fundamental(Fhl2, period = agg2ST)[1];
def ATR2 = MovingAverage(AvgType, TrueRange(h2, c2, l2), nATR);
def UP2 = hl2 + (AtrMult * ATR2);
def DN2 = hl2 + (-AtrMult * ATR2);
def S2A = if c2 < S2A[1]
then Round(UP2 / tickSize(), 0) * tickSize()
else Round(DN2 / tickSize(), 0) * tickSize();
def SecondAgg = if c2 > S2A then 1 else 0;
plot SecondAggPlot = if isNaN(cl)
then double.nan
else 21;
SecondAggPlot.SetStyle(Curve.Points);
SecondAggPlot.SetLineWeight(3);
SecondAggPlot.AssignValueColor(if SecondAgg == 1
then color.green
else color.red);
AddChartBubble(x, 2, (agg2ST/1000/60) + " min", color.white, yes);

## ThirdAgg
#def h3 = Fundamental(Fh, period = agg3ST)[1];
#def l3 = Fundamental(Fl, period = agg3ST)[1];
#def c3 = Fundamental(Fc, period = agg3ST)[1];
#def hl3 = Fundamental(Fhl2, period = agg3ST)[1];
#def ATR3 = MovingAverage(AvgType, TrueRange(h3, c3, l3), nATR);
#def UP3 = hl3 + (AtrMult * ATR3);
#def DN3 = hl3 + (-AtrMult * ATR3);
#def S3 = if c3 < S3[1]
#then Round(UP3 / tickSize(), 0) * tickSize()
#else Round(DN3 / tickSize(), 0) * tickSize();
#def ThirdAgg = if c3 > S3 then 1 else 0;
#plot ThirdAggPlot = if isNaN(cl)
#then double.nan
#else 23;
#ThirdAggPlot.SetStyle(Curve.Points);
#ThirdAggPlot.SetLineWeight(3);
#ThirdAggPlot.AssignValueColor(if ThirdAgg == 1
#then color.green
#else color.red);
#AddChartBubble(x, 3, (agg3ST/1000/60) + " min", color.white, yes);

## FourthAgg
#def h4 = Fundamental(Fh, period = agg4ST)[1];
#def l4 = Fundamental(Fl, period = agg4ST)[1];
#def c4 = Fundamental(Fc, period = agg4ST)[1];
#def hl4 = Fundamental(Fhl2, period = agg4ST)[1];
#def ATR4 = MovingAverage(AvgType, TrueRange(h4, c4, l4), nATR);
#def UP4 = hl4 + (AtrMult * ATR4);
#def DN4 = hl4 + (-AtrMult * ATR4);
#def S4 = if c4 < S4[1]
#then Round(UP4 / tickSize(), 0) * tickSize()
#else Round(DN4 / tickSize(), 0) * tickSize();
#def FourthAgg = if c4 > S4 then 1 else 0;
#plot FourthAggPlot = if isNaN(cl)
#then double.nan
#else 25;
#FourthAggPlot.SetStyle(Curve.Points);
#FourthAggPlot.SetLineWeight(3);
#FourthAggPlot.AssignValueColor(if FourthAgg == 1
#then color.green
#else color.red);
#AddChartBubble(x, 4, (agg4ST/1000/60) + " min", color.white, yes);

## FifthAgg
#def h5 = Fundamental(Fh, period = agg5ST)[1];
#def l5 = Fundamental(Fl, period = agg5ST)[1];
#def c5 = Fundamental(Fc, period = agg5ST)[1];
#def hl5 = Fundamental(Fhl2, period = agg5ST)[1];
#def ATR5 = MovingAverage(AvgType, TrueRange(h5, c5, l5), nATR);
#def UP5 = hl5 + (AtrMult * ATR5);
#def DN5 = hl5 + (-AtrMult * ATR5);
#def S5 = if c5 < S5[1]
#then Round(UP5 / tickSize(), 0) * tickSize()
#else Round(DN5 / tickSize(), 0) * tickSize();
#def FifthAgg = if c5 > S5 then 1 else 0;
#plot FifthAggPlot = if isNaN(cl)
#then double.nan
#else 27;
#FifthAggPlot.SetStyle(Curve.Points);
#FifthAggPlot.SetLineWeight(3);
#FifthAggPlot.AssignValueColor(if FifthAgg == 1
#then color.green
#else color.red);
#AddChartBubble(x, 5, (agg5ST/1000/60)+ " min", color.white, yes);
#plot Six = if isNaN(cl)
#then double.nan
#else 0;
#Six.SetStyle(Curve.Points);
#Six.SetLineWeight(3);
#Six.AssignValueColor(if FirstAgg and
#SecondAgg and
#ThirdAgg and
#FourthAgg and
#FifthAgg
#then color.green
#else if !FirstAgg and
#!SecondAgg and
#!ThirdAgg and
#!FourthAgg and
#!FifthAgg
#then color.red
#else color.black);
# End Code ST MTF
#
#
## Heiken Aski Multi-Time Frame
## 2019 Paul Townsend v3
#declare lower;

input UsePeriod = AggregationPeriod.TEN_MIN;

def aOpen = open(period = UsePeriod);
def aClose = close(period = UsePeriod);
def aHigh = high(period = UsePeriod);
def aLow = low(period = UsePeriod);

def haClose = (aOpen + aClose + aHigh + aLow) / 4;
def haOpen = (haOpen[1] + haClose[1]) / 2;

#AssignPriceColor(if haOpen < haClose then Color.GRAY else
#if haOpen > haClose then Color.DOWNTICK else Color.WHITE);

#AddLabel(yes, "[" + UsePeriod / 60000 + "]", Color.WHITE);

# STATE
def sState1 = if HAclose > HAopen then 100 else -100;

plot data1 = sState1;#} #end of HeikinAshiCandles
#</SCRIPT>

# STATE

#def sState = HeikinAshiCandles();

# LOWER PLOT

plot pDB1 = 19;
pDB1.AssignValueColor(
if IsNaN(sState1) then Color.DARK_GRAY else
if sState1 == 100 then Color.GREEN else
Color.RED);
pDB1.SetPaintingStrategy (PaintingStrategy.POINTS);
pDB1.SetLineWeight(2);
pDB1.HideTitle();
pDB1.HideBubble();

# END OF EXAMPLE PLOT

#NAME: HeikinAshiCandles - EXAMPLE LOWER PLOT
#VERSION: 2019.10.20
#TEMPLATE: 2019.10.20
#DESC: Plots Heikin Ashi Candles
#TYPE: 1
#CHANGELOG
# 2019.10.17 - Original Release
#
#
# Version 1.0 @diazlaz - for @markos
#

#<SCRIPT>
script HeikinAshiCandles { #20191017
def h = high;
def l = low;
def o = open;
def c = close;

def HAopen;
def HAhigh;
def HAlow;
def HAclose;
HAopen = CompoundValue(1, (HAopen[1] + HAclose[1]) / 2, (o[1] + c[1]) / 2);
HAhigh = Max(Max(h, HAopen), HAclose[1]);
HAlow = Min(Min(l, HAopen), HAclose[1]);
HAclose = (o + h + l + c) / 4;

# STATE
def sState1 = if HAclose > HAopen then 100 else -100;

plot data = sState1;
} #end of HeikinAshiCandles
#</SCRIPT>

# STATE
def sState = HeikinAshiCandles();

# LOWER PLOT

plot pDB2 = -19;
pDB2.AssignValueColor(
if IsNaN(sState) then Color.DARK_GRAY else
if sState == 100 then COLOR.GREEN else
COLOR.RED);
pDB2.SetPaintingStrategy (PaintingStrategy.POINTS);
pDB2.SetLineWeight(2);
pDB2.HideTitle();
pDB2.HideBubble();

# END OF EXAMPLE PLOT
Attachments
Last edited by a moderator:


