
The following indicators were made by me back in May and June of 2023. They represent some signals I was interested in researching at the time that I now want to share with the community. It has been a while since I made these so there may be holes in my ability to explain everything and answer questions.
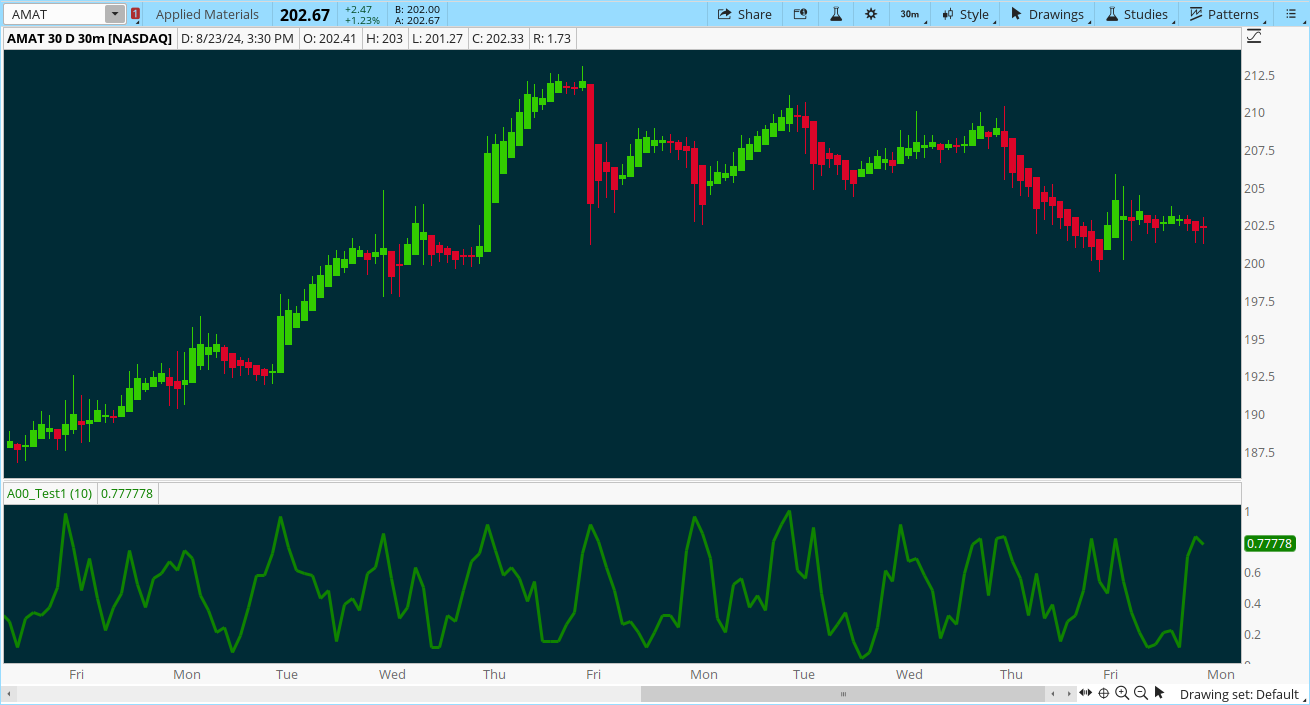
The first is the manipulation of the alpha factor in the ema calculation:

I set about doing this by taking the Z score percentile across what I considered to be critical metrics such as measures of volume and volatility. The code for a lower indicator that displays this is attached below. Also attached is the question the community helped answer so I could do those calculations. You could Z-Score percentile any number of signals you wanted to adjust EMA sensitivity. The indicator gives a wide variety of examples.
Alpha Oscillator question: https://usethinkscript.com/threads/fold-function-counter.15604/post-125990
The next thing I was interested in was designing a decaying sum type function for this signal. Details can be found in the question below. In that process I also wanted to code up the ability to display the average of any number of moving average signals within a set of bounds and apply it to this new signal. For example, averaging every signal between length 6 and 14 then seeing how it compares to the vanilla signal at just 10. There is a very slight difference that interesting to study on a chart. The nested folds required to do this was very difficult to code and I couldn't have done it without the help of folks here.
Fold Function question: https://usethinkscript.com/threads/nested-fold-function-debugging.15685/post-129929
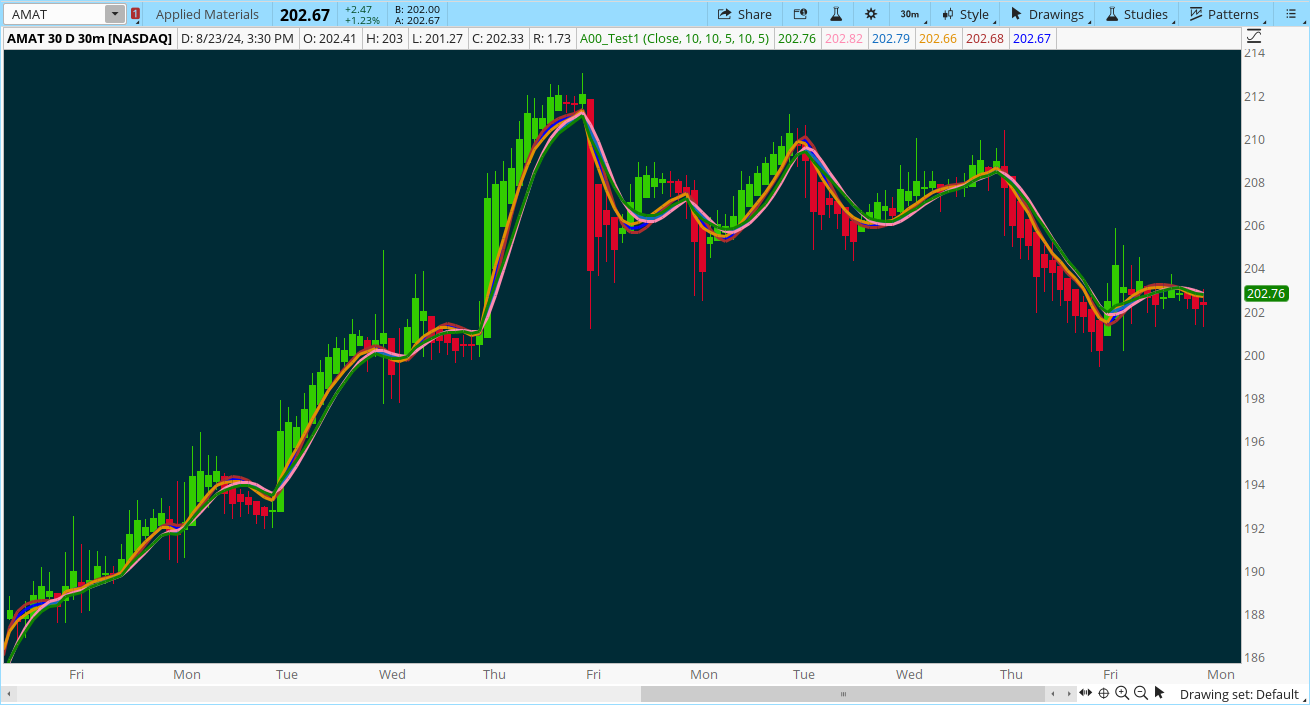
To put all of this together, I made myself a little playground that can yield just about any form of this signal you could imagine. That code will be pasted below. It is a bit complex, but I think there are concepts in it that would be awesome to see other folks run with to craft their own signals.
For the plots here it is important to note that plots labeled with 1 don't use any smoothing, 2 averages a smoothed signal with the unsmoothed one, and 3 is fully smoothed. Together, these make for some interesting ribbons. The code for this is pasted below:
The first is the manipulation of the alpha factor in the ema calculation:
I set about doing this by taking the Z score percentile across what I considered to be critical metrics such as measures of volume and volatility. The code for a lower indicator that displays this is attached below. Also attached is the question the community helped answer so I could do those calculations. You could Z-Score percentile any number of signals you wanted to adjust EMA sensitivity. The indicator gives a wide variety of examples.
Alpha Oscillator question: https://usethinkscript.com/threads/fold-function-counter.15604/post-125990
Code:
#Alpha Oscillator
#StoneMan (StoneFelt)
#8.25.2024
#V1.0
#Calculates the Z-Score percentile of multiple metrics and combines them into one signal


declare lower;

input Length = 10;

#Calculating volitility Z-Score percentile, true range used as volitility metric
def TrueRange = TrueRange(high, close, low); #Observed value
def TR_Average = Average(TrueRange, Length); #Mean of sample
def TR_StDev = StDev(TrueRange, Length);     #Standard Deviation of sample

def TR_Z_Score = (TrueRange - TR_Average) / TR_StDev;

def TR_Z_Percent_Count =
    fold i = 0
    to Length
    with S = 0
    do S + if (TR_Z_Score > getValue(TR_Z_Score, i, Length)) then 1 else 0;

def TR_Percentile = TR_Z_Percent_Count / (Length - 1);

#Calculating volume Z-Score percentile
Def V = Volume;                     #Observed value
def V_Average = Average(V, Length); #Mean of sample
def V_StDev = StDev(V, Length);     #Standard Deviation of sample

def V_Z_Score = (V - V_Average) / V_StDev;

def V_Z_Percent_Count =
    fold j = 0
    to Length
    with Q = 0
    do Q + if (V_Z_Score > getValue(V_Z_Score, j, Length)) then 1 else 0;

def V_Percentile = V_Z_Percent_Count / (Length - 1);

#Calculating Close Price Z-Score percentile
#Use absolute value of Z-score to examine distance from price mean
Def C = Close;                      #Observed value
def C_Average = Average(C, Length); #Mean of sample
def C_StDev = StDev(C, Length);     #Standard Deviation of sample

def C_Z_Score = AbsValue((C - C_Average) / C_StDev);

def C_Z_Percent_Count =
    fold n = 0
    to Length
    with R = 0
    do R + if (C_Z_Score > getValue(C_Z_Score, n, Length)) then 1 else 0;

def C_Percentile = C_Z_Percent_Count / (Length - 1);

#Calculating OHLC4 Price Z-Score percentile
#Use absolute value of Z-score to examine distance from price mean
Def OHCL4 = OHLC4;                          #Observed value
def OHCL4_Average = Average(OHCL4, Length); #Mean of sample
def OHCL4_StDev = StDev(OHCL4, Length);     #Standard Deviation of sample

def OHCL4_Z_Score = AbsValue((OHCL4 - OHCL4_Average) / OHCL4_StDev);

def OHCL4_Z_Percent_Count =
    fold t = 0
    to Length
    with U = 0
    do U + if (OHCL4_Z_Score > getValue(OHCL4_Z_Score, t, Length)) then 1 else 0;

def OHCL4_Percentile = OHCL4_Z_Percent_Count / (Length - 1);


#Calculating volitility Z-Score percentile using difference between open and close
def OpenCloseDiff = AbsValue(open - close);      #Observed value
def OCD_Average = Average(OpenCloseDiff, Length); #Mean of sample
def OCD_StDev = StDev(OpenCloseDiff, Length);     #Standard Deviation of sample

def OCD_Z_Score = (OpenCloseDiff - OCD_Average) / OCD_StDev;

def OCD_Z_Percent_Count =
    fold g = 0
    to Length
    with F = 0
    do F + if (OCD_Z_Score > getValue(OCD_Z_Score, g, Length)) then 1 else 0;

def OCD_Percentile = OCD_Z_Percent_Count / (Length - 1);

def Alpha = (TR_Percentile + OCD_Percentile + C_Percentile + OHCL4_Percentile + (2 * V_Percentile)) / 6;
plot AlphaPlot = Alpha;
The next thing I was interested in was designing a decaying sum type function for this signal. Details can be found in the question below. In that process I also wanted to code up the ability to display the average of any number of moving average signals within a set of bounds and apply it to this new signal. For example, averaging every signal between length 6 and 14 then seeing how it compares to the vanilla signal at just 10. There is a very slight difference that interesting to study on a chart. The nested folds required to do this was very difficult to code and I couldn't have done it without the help of folks here.
Fold Function question: https://usethinkscript.com/threads/nested-fold-function-debugging.15685/post-129929
To put all of this together, I made myself a little playground that can yield just about any form of this signal you could imagine. That code will be pasted below. It is a bit complex, but I think there are concepts in it that would be awesome to see other folks run with to craft their own signals.
For the plots here it is important to note that plots labeled with 1 don't use any smoothing, 2 averages a smoothed signal with the unsmoothed one, and 3 is fully smoothed. Together, these make for some interesting ribbons. The code for this is pasted below:
Code:
#Research Signal Playground
#StoneMan (StoneFelt)
#8.25.2024
#V1.0
#Accumulates to research of some custom signal generation into one indicator for easy use.

input FilterPriceType = {default Close, HLC3, OHLC4, Extreme}; #choose the price you want analyzed
input AlphaPeriod = 10; #Period Z score percentiles are averaged over to get alpha weighting
input Length1 = 10; #Controls the period of the vanilla alpha weighted ma (AWMA)
input SmoothingFactor = 5; #optional smoothing. Plot 1's have no smoothing plot 2's and 3's have some

input SuperAverageLength1 = 10; #Every AWMA between these bounds are calculated, averaged, then displayed as one vslue
input SuperAverageLength2 = 5;  #Code is set up so either bound can be high or low


script A{
input Length = 10;

#Calculating volitility Z-Score percentile, true range used as volitility metric
def TrueRange = TrueRange(high, close, low); #Observed value
def TR_Average = Average(TrueRange, Length); #Mean of sample
def TR_StDev = StDev(TrueRange, Length);     #Standard Deviation of sample

def TR_Z_Score = (TrueRange - TR_Average) / TR_StDev;

def TR_Z_Percent_Count =
    fold i = 0
    to Length
    with S = 0
    do S + if (TR_Z_Score > getValue(TR_Z_Score, i, Length)) then 1 else 0;

def TR_Percentile = TR_Z_Percent_Count / (Length - 1);

#Calculating volume Z-Score percentile
Def V = Volume;                     #Observed value
def V_Average = Average(V, Length); #Mean of sample
def V_StDev = StDev(V, Length);     #Standard Deviation of sample

def V_Z_Score = (V - V_Average) / V_StDev;

def V_Z_Percent_Count =
    fold j = 0
    to Length
    with B = 0
    do B + if (V_Z_Score > getValue(V_Z_Score, j, Length)) then 1 else 0;

def V_Percentile = V_Z_Percent_Count / (Length - 1);

#Calculating Close Price Z-Score percentile
#Use absolute value of Z-score to examine distance from price mean
Def C = Close;                      #Observed value
def C_Average = Average(C, Length); #Mean of sample
def C_StDev = StDev(C, Length);     #Standard Deviation of sample

def C_Z_Score = AbsValue((C - C_Average) / C_StDev);

def C_Z_Percent_Count =
    fold n = 0
    to Length
    with Y = 0
    do Y + if (C_Z_Score > getValue(C_Z_Score, n, Length)) then 1 else 0;

def C_Percentile = C_Z_Percent_Count / (Length - 1);

#Calculating OHLC4 Price Z-Score percentile
#Use absolute value of Z-score to examine distance from price mean
Def OHCL4 = OHLC4;                          #Observed value
def OHCL4_Average = Average(OHCL4, Length); #Mean of sample
def OHCL4_StDev = StDev(OHCL4, Length);     #Standard Deviation of sample

def OHCL4_Z_Score = AbsValue((OHCL4 - OHCL4_Average) / OHCL4_StDev);

def OHCL4_Z_Percent_Count =
    fold t = 0
    to Length
    with M = 0
    do M + if (OHCL4_Z_Score > getValue(OHCL4_Z_Score, t, Length)) then 1 else 0;

def OHCL4_Percentile = OHCL4_Z_Percent_Count / (Length - 1);


#Calculating volitility Z-Score percentile using difference between open and close
def OpenCloseDiff = AbsValue(open - close);      #Observed value
def OCD_Average = Average(OpenCloseDiff, Length); #Mean of sample
def OCD_StDev = StDev(OpenCloseDiff, Length);     #Standard Deviation of sample

def OCD_Z_Score = (OpenCloseDiff - OCD_Average) / OCD_StDev;

def OCD_Z_Percent_Count =
    fold d = 0
    to Length
    with F = 0
    do F + if (OCD_Z_Score > getValue(OCD_Z_Score, d, Length)) then 1 else 0;

def OCD_Percentile = OCD_Z_Percent_Count / (Length - 1);

plot Alpha = (TR_Percentile + OCD_Percentile + C_Percentile + OHCL4_Percentile + (2 * V_Percentile)) / 6;
}

#Price Types to generate base level infinite impulse filters
def CloseEma = A(AlphaPeriod) * close + (1 - A(AlphaPeriod)) * CloseEma[1];
def HighEma = A(AlphaPeriod) * high + (1 - A(AlphaPeriod)) * HighEma[1];
def LowEma = A(AlphaPeriod) * low + (1 - A(AlphaPeriod)) * LowEma[1];
def OpenEma = A(AlphaPeriod) * open + (1 - A(AlphaPeriod)) * OpenEma[1];

def Extreme = if (close > close[1], high, if(close < close[1], low, close));
def HLC3Ema = (CloseEma + HighEma + LowEma) / 3;
def OHLC4Ema = (CloseEma + HighEma + LowEma + OpenEma) / 4;


#Price type selection for filters
def avgEMA;

switch(FilterPriceType){
Case Close:
    avgEMA = CloseEMA;
Case HLC3:
    avgEMA = HLC3Ema;
Case OHLC4:
    avgEMA = OHLC4Ema;
Case Extreme:
    avgEMA = Extreme;
}

#Zero lag smoothing algoritm applied to filters output
def avgEMASmooth = 2 * WMA(avgEMA, SmoothingFactor) - WMA(WMA(avgEMA, SmoothingFactor), SmoothingFactor);

#Averaging the smoothed and unsmoothed data
def NormSmoothAvg = (avgEMA + avgEMASmooth) / 2;


Script F {
Input Length = 10;

Input data = 3.7453;

def FilterData =
    fold a = 0
    to Length
    with K = 0
    do K + data[a]*(Length - a);

def FilterCount =
    fold i = 0
    to Length + 1
    with P = 0
    do P + i;

def FilterAverage = FilterData / FilterCount;

plot Filter = FilterAverage;
}

#Input function F as (length, data)
def Plot1Function = F(Length1, avgEMA);
plot Plot1 = Plot1Function;

#Examining smoothing of the input data to F, I checked and smoothing input same as smoothing output
#So averageing the inputs is the same as average the outputs
def Plot2Function = F(Length1, avgEMASmooth);
plot Plot2 = Plot2Function;

def plot3Function = F(Length1, NormSmoothAvg);
plot Plot3 = Plot3Function;


#For the superaverage function you will be able to input both lengths and a the data
#When function F is calle be sure to set the data to the input of this function

Script S{
input SupAvgLength1 = 10;
input SupAvgLength2 = 5;
input data = 3.5632;

#Number to divide moving averages by
def LengthDiff = AbsValue(SupAvgLength1 - SupAvgLength2) / 2;

def SuperAverage =
    if(SupAvgLength1 == SupAvgLength2, F(SupAvgLength1, data),
            (Fold q = if(SupAvgLength1 < SupAvgLength2, SupAvgLength1, SupAvgLength2)
             to if(SupAvgLength1 > SupAvgLength2, SupAvgLength1, SupAvgLength2)
             with R = 0
             do R + (
                     #Implementing nested fold function because ThinkScript cannot do F(q) but we can recreate function F
                     (Fold u = 0
                     to q
                     with X = 0
                     do X + GetValue(data, u)*(q-u)) /
                     #Now divide this by the filter count function as we do in F
                     (Fold w = 0
                     to q + 1
                     with G = 0
                     do G + q)
                     )
             ) / LengthDiff
      )
;

plot OutPut = SuperAverage;
}

#Input function S as (SuperAverageLength1, SuperAverageLength2, data)
def SuperPlot1Function = S(SuperAverageLength1, SuperAverageLength2, avgEMA);
plot SuperPlot1 = SuperPlot1Function;

def SuperPlot2Function = S(SuperAverageLength1, SuperAverageLength2, avgEMASmooth);
plot SuperPlot2 = SuperPlot2Function;

def SuperPlot3Function = S(SuperAverageLength1, SuperAverageLength2, NormSmoothAvg);
plot SuperPlot3 = SuperPlot3Function;
Last edited by a moderator: