Mega 8 Trend Directional Study

Manbirsr

New member
VIP
Hi,
I am trying to see if anyone can help me with this script. It shows 8 different stocks of your choice and if they they are up and down for the day/week. I was wondering if it would be possible to have this script convert this into 5 min, 2 min, 1 min and shows the trend based on 9, 20 and 50 EMA. I am not the owner of this script hence got it from someone.

Code:
declare upper;

input Stock = "AAPL";
input Stock2 = "MSFT";
input Stock3 = "AMZN";
input Stock4 = "GOOGL";
input Stock5 = "TSLA";
input Stock6 = "NVDA";
input Stock7 = "META";
input Stock8 = "USO";
input Period = {default Day, Week, Month, Quarter, Year};

def aggregations;
switch (Period) {
case Day:
   
    aggregations = AggregationPeriod.FOUR_HOURS;
case Week:
    aggregations = AggregationPeriod.WEEK;
case Month:
    aggregations = AggregationPeriod.MONTH;
case Quarter:
    aggregations = AggregationPeriod.QUARTER;
case Year:
    aggregations = AggregationPeriod.YEAR;
}

#def aggregationPeriod = AggregationPeriod.DAY;
def aggregationPeriod = Period;

def Stockopen = open(Stock, aggregationPeriod);
def Stockclose = close(Stock);
def Stockdiff = close (Stock) - open(Stock, period = aggregationPeriod);
def Stock_d_pct = 100 * Stockdiff / Stockopen;
AddLabel(yes, Stock + " " + Stock_d_pct + "%" + " " + AsDollars(Stockclose), if Stockdiff > 0 then Color.GREEN else if Stockdiff < 0 then Color.RED else Color.GRAY);


def Stock2open = open(Stock2, aggregationPeriod);
def Stock2close = close(Stock2);
def Stock2diff = close (Stock2) - open(Stock2, period = aggregationPeriod);
def Stock2_d_pct = 100 * Stock2diff / Stock2open;
AddLabel(yes, Stock2 + " " + Stock2_d_pct + "%" + " " + AsDollars(Stock2close), if Stock2diff > 0 then Color.GREEN else if Stock2diff < 0 then Color.RED else Color.GRAY);


def Stock3open = open(Stock3, aggregationPeriod);
def Stock3close = close(Stock3);
def Stock3diff = close (Stock3) - open(Stock3, period = aggregationPeriod);
def Stock3_d_pct = 100 * Stock3diff / Stock3open;
AddLabel(yes, Stock3 + " " + Stock3_d_pct + "%" + " " + AsDollars(Stock3close), if Stock3diff > 0 then Color.GREEN else if Stock3diff < 0 then Color.RED else Color.GRAY);

def Stock4open = open(Stock4, aggregationPeriod);
def Stock4close = close(Stock4);
def Stock4diff = close (Stock4) - open(Stock4, period = aggregationPeriod);
def Stock4_d_pct = 100 * Stock4diff / Stock4open;
AddLabel(yes, Stock4 + " " + Stock4_d_pct + "%" + " " + AsDollars(Stock4close), if Stock4diff > 0 then Color.GREEN else if Stock4diff < 0 then Color.RED else Color.GRAY);

def Stock5open = open(Stock5, aggregationPeriod);
def Stock5close = close(Stock5);
def Stock5diff = close (Stock5) - open(Stock5, period = aggregationPeriod);
def Stock5_d_pct = 100 * Stock5diff / Stock5open;
AddLabel(yes, Stock5 + " " + Stock5_d_pct + "%" + " " + AsDollars(Stock5close), if Stock5diff > 0 then Color.GREEN else if Stock5diff < 0 then Color.RED else Color.GRAY);

def Stock6open = open(Stock6, aggregationPeriod);
 
Last edited by a moderator:
Solution
Yes that is correct

Here you go:

Code:
def Stock1 = close("AAPL");
def Stock2 = close("MSFT");
def Stock3 = close("AMZN");
def Stock4 = close("GOOGL");
def Stock5 = close("TSLA");
def Stock6 = close("NVDA");
def Stock7 = close("META");
def Stock8 = close("USO");
input length = 20;
input Period = {default Day, Week, Month, Quarter, Year};

def aggregations;
switch (Period) {
case Day:

    aggregations = AggregationPeriod.FOUR_HOURS;
case Week:
    aggregations = AggregationPeriod.WEEK;
case Month:
    aggregations = AggregationPeriod.MONTH;
case Quarter:
    aggregations = AggregationPeriod.QUARTER;
case Year:
    aggregations = AggregationPeriod.YEAR;
}

#def aggregationPeriod = AggregationPeriod.DAY;
def aggregationPeriod =...
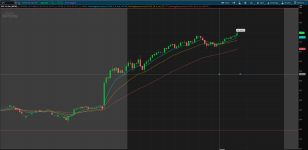
Yes if you look at spy on this chart it is above the EMA's I would consider that uptrend regardless how much it is up for the day and if its under those that would be down trend.
 

Attachments

  • Screenshot 2024-08-15 110505.png
    Screenshot 2024-08-15 110505.png
    216.4 KB · Views: 155
Yes if you look at spy on this chart it is above the EMA's I would consider that uptrend regardless how much it is up for the day and if its under those that would be down trend.
yes , we get that.
he was asking, what do you want to see on the chart?
arrows? , labels? bubbles? colored lines?
if you plot 8 different stocks on 1 chart, this difference in prices will spread them apart, so as they will appear as near horizontal lines and have no distinguishing features.

so, you want to replace the day,week,month,year,
with 5min,2min,1min ?
 
Sorry I was confused about it.
Yes a label or even a arrow would suffice.

and yes those are the time frames I am looking for since I scalp options so looking to get in and out quickly based on the momentum.
 
Sorry I was confused about it.
Yes a label or even a arrow would suffice.

and yes those are the time frames I am looking for since I scalp options so looking to get in and out quickly based on the momentum.

You have a lot of timeframes for which you want to check for uptrends and downtrends. Does the stock have to be above all the timeframes you listed to be considered "uptrend"? If you're only considering each timeframe by itself, then you're going to be A LOT of labels on your chart, which can be confusing.
 
Would it be possible to just have it on 5 minute timeframe then?

Sure, that's a good starting point.

So you want a label for each ticker, correct? For example, if AAPL is above a specific moving average, then the label will be green and say "Uptrend"?
 
Yes that is correct

Here you go:

Code:
def Stock1 = close("AAPL");
def Stock2 = close("MSFT");
def Stock3 = close("AMZN");
def Stock4 = close("GOOGL");
def Stock5 = close("TSLA");
def Stock6 = close("NVDA");
def Stock7 = close("META");
def Stock8 = close("USO");
input length = 20;
input Period = {default Day, Week, Month, Quarter, Year};

def aggregations;
switch (Period) {
case Day:

    aggregations = AggregationPeriod.FOUR_HOURS;
case Week:
    aggregations = AggregationPeriod.WEEK;
case Month:
    aggregations = AggregationPeriod.MONTH;
case Quarter:
    aggregations = AggregationPeriod.QUARTER;
case Year:
    aggregations = AggregationPeriod.YEAR;
}

#def aggregationPeriod = AggregationPeriod.DAY;
def aggregationPeriod = Period;

AddLabel(yes, if Stock1 > MovingAverage(aggregationPeriod, stock1, Length) then ("$AAPL Bullish") else ("$AAPL Bearish"), if Stock1 > MovingAverage(aggregationPeriod, stock1, Length) then color.green else color.red);

AddLabel(yes, if Stock2 > MovingAverage(aggregationPeriod, stock2, Length) then ("$MSFT Bullish") else ("$MSFT Bearish"), if Stock2 > MovingAverage(aggregationPeriod, stock2, Length) then color.green else color.red);

AddLabel(yes, if Stock3 > MovingAverage(aggregationPeriod, stock3, Length) then ("$AMZN Bullish") else ("$AMZN Bearish"), if Stock3 > MovingAverage(aggregationPeriod, stock3, Length) then color.green else color.red);

AddLabel(yes, if Stock4 > MovingAverage(aggregationPeriod, stock4, Length) then ("$GOOGL Bullish") else ("$GOOGL Bearish"), if Stock4 > MovingAverage(aggregationPeriod, stock4, Length) then color.green else color.red);

AddLabel(yes, if Stock5 > MovingAverage(aggregationPeriod, stock5, Length) then ("$TSLA Bullish") else ("$TSLA Bearish"), if Stock5 > MovingAverage(aggregationPeriod, stock5, Length) then color.green else color.red);

AddLabel(yes, if Stock6 > MovingAverage(aggregationPeriod, stock6, Length) then ("$NVDA Bullish") else ("$NVDA Bearish"), if Stock6 > MovingAverage(aggregationPeriod, stock6, Length) then color.green else color.red);

AddLabel(yes, if Stock7 > MovingAverage(aggregationPeriod, stock7, Length) then ("$META Bullish") else ("$META Bearish"), if Stock7 > MovingAverage(aggregationPeriod, stock7, Length) then color.green else color.red);

AddLabel(yes, if Stock8 > MovingAverage(aggregationPeriod, stock8, Length) then ("$USO Bullish") else ("$USO Bearish"), if Stock8 > MovingAverage(aggregationPeriod, stock8, Length) then color.green else color.red);

The default timeframe is Daily, and the default length of the moving average is 20. You can freely change these values in the indicator's settings.

The tickers and labels are hard coded. You will need to open the script editor to change them.
 
Solution
Here you go:

Code:
def Stock1 = close("AAPL");
def Stock2 = close("MSFT");
def Stock3 = close("AMZN");
def Stock4 = close("GOOGL");
def Stock5 = close("TSLA");
def Stock6 = close("NVDA");
def Stock7 = close("META");
def Stock8 = close("USO");
input length = 20;
input Period = {default Day, Week, Month, Quarter, Year};

def aggregations;
switch (Period) {
case Day:

    aggregations = AggregationPeriod.FOUR_HOURS;
case Week:
    aggregations = AggregationPeriod.WEEK;
case Month:
    aggregations = AggregationPeriod.MONTH;
case Quarter:
    aggregations = AggregationPeriod.QUARTER;
case Year:
    aggregations = AggregationPeriod.YEAR;
}

#def aggregationPeriod = AggregationPeriod.DAY;
def aggregationPeriod = Period;

AddLabel(yes, if Stock1 > MovingAverage(aggregationPeriod, stock1, Length) then ("$AAPL Bullish") else ("$AAPL Bearish"), if Stock1 > MovingAverage(aggregationPeriod, stock1, Length) then color.green else color.red);

AddLabel(yes, if Stock2 > MovingAverage(aggregationPeriod, stock2, Length) then ("$MSFT Bullish") else ("$MSFT Bearish"), if Stock2 > MovingAverage(aggregationPeriod, stock2, Length) then color.green else color.red);

AddLabel(yes, if Stock3 > MovingAverage(aggregationPeriod, stock3, Length) then ("$AMZN Bullish") else ("$AMZN Bearish"), if Stock3 > MovingAverage(aggregationPeriod, stock3, Length) then color.green else color.red);

AddLabel(yes, if Stock4 > MovingAverage(aggregationPeriod, stock4, Length) then ("$GOOGL Bullish") else ("$GOOGL Bearish"), if Stock4 > MovingAverage(aggregationPeriod, stock4, Length) then color.green else color.red);

AddLabel(yes, if Stock5 > MovingAverage(aggregationPeriod, stock5, Length) then ("$TSLA Bullish") else ("$TSLA Bearish"), if Stock5 > MovingAverage(aggregationPeriod, stock5, Length) then color.green else color.red);

AddLabel(yes, if Stock6 > MovingAverage(aggregationPeriod, stock6, Length) then ("$NVDA Bullish") else ("$NVDA Bearish"), if Stock6 > MovingAverage(aggregationPeriod, stock6, Length) then color.green else color.red);

AddLabel(yes, if Stock7 > MovingAverage(aggregationPeriod, stock7, Length) then ("$META Bullish") else ("$META Bearish"), if Stock7 > MovingAverage(aggregationPeriod, stock7, Length) then color.green else color.red);

AddLabel(yes, if Stock8 > MovingAverage(aggregationPeriod, stock8, Length) then ("$USO Bullish") else ("$USO Bearish"), if Stock8 > MovingAverage(aggregationPeriod, stock8, Length) then color.green else color.red);

The default timeframe is Daily, and the default length of the moving average is 20. You can freely change these values in the indicator's settings.

The tickers and labels are hard coded. You will need to open the script editor to change them.
Thank you so much
 

Join useThinkScript to post your question to a community of 21,000+ developers and traders.

Similar threads

Not the exact question you're looking for?

Start a new thread and receive assistance from our community.

87k+ Posts
457 Online
Create Post

Similar threads

Similar threads

The Market Trading Game Changer

Join 2,500+ subscribers inside the useThinkScript VIP Membership Club
  • Exclusive indicators
  • Proven strategies & setups
  • Private Discord community
  • ‘Buy The Dip’ signal alerts
  • Exclusive members-only content
  • Add-ons and resources
  • 1 full year of unlimited support

Frequently Asked Questions

What is useThinkScript?

useThinkScript is the #1 community of stock market investors using indicators and other tools to power their trading strategies. Traders of all skill levels use our forums to learn about scripting and indicators, help each other, and discover new ways to gain an edge in the markets.

How do I get started?

We get it. Our forum can be intimidating, if not overwhelming. With thousands of topics, tens of thousands of posts, our community has created an incredibly deep knowledge base for stock traders. No one can ever exhaust every resource provided on our site.

If you are new, or just looking for guidance, here are some helpful links to get you started.

What are the benefits of VIP Membership?
VIP members get exclusive access to these proven and tested premium indicators: Buy the Dip, Advanced Market Moves 2.0, Take Profit, and Volatility Trading Range. In addition, VIP members get access to over 50 VIP-only custom indicators, add-ons, and strategies, private VIP-only forums, private Discord channel to discuss trades and strategies in real-time, customer support, trade alerts, and much more. Learn all about VIP membership here.
How can I access the premium indicators?
To access the premium indicators, which are plug and play ready, sign up for VIP membership here.
Back
Top