Median function with non-contiguous bars over a range

hboogie

Active member
Plus
Hi all --

Is it possible to calculate a filtered median or use the median function recursively on a filtered set of data? For example, I want to calculate the median high of only green bars over the last 30 bars (not over the last 30 green bars, but for example if there are 12 green bars in the last 30, I want the median of the highs for only those 12 green bars). Mobius said it’s possible in thinkscript (but declined to demonstrate), but I haven’t been able to figure out how to do it. I vaguely remember seeing @Svanoy post something similar, but could be wrong. I hope you don’t mind that I tagged you.

Thanks!

H
 
Solution
Hi all --

Is it possible to calculate a filtered median or use the median function recursively on a filtered set of data? For example, I want to calculate the median high of only green bars over the last 30 bars (not over the last 30 green bars, but for example if there are 12 green bars in the last 30, I want the median of the highs for only those 12 green bars). Mobius said it’s possible in thinkscript (but declined to demonstrate), but I haven’t been able to figure out how to do it. I vaguely remember seeing @Svanoy post something similar, but could be wrong. I hope you don’t mind that I tagged you.

Thanks!

H

this looked interesting, so i gave it a try
i always start by rewriting the rules in simple, short ...
Hi all --

Is it possible to calculate a filtered median or use the median function recursively on a filtered set of data? For example, I want to calculate the median high of only green bars over the last 30 bars (not over the last 30 green bars, but for example if there are 12 green bars in the last 30, I want the median of the highs for only those 12 green bars). Mobius said it’s possible in thinkscript (but declined to demonstrate), but I haven’t been able to figure out how to do it. I vaguely remember seeing @Svanoy post something similar, but could be wrong. I hope you don’t mind that I tagged you.

Thanks!

H

this looked interesting, so i gave it a try
i always start by rewriting the rules in simple, short , statements
then i verify the question. (look up median.)
then start brainstorming and writing ideas as comments in the code.

i had an idea a double loop would be needed to compare a number to all the choices, over and over,...
if you want the middle number, then need to loop through half the quantity of signals (grncnt)

it finds 2 middle numbers, so if the count is even, it takes the average of them,
if the count is odd, then it uses the 2nd middle number.

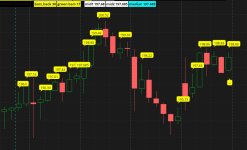
draws a vertical line to show the boundary of the bar quantity
bubbles show the green bar highs
labels show the 2 middle numbers, and the median #

Code:
#median_non_conseq_data
# halcyonguy
# 25-08-07

#https://usethinkscript.com/threads/median-function-with-non-contiguous-bars-over-a-range.21382/
#Median function with non-contiguous bars over a range
#hboogie  8/7
#1

#Is it possible to calculate a filtered median or use the median function recursively on a filtered set of data?
# For example, I want to calculate the median high,
#  of only green bars,
#   over the last 30 bars.   (not over the last 30 green bars)

# but for example,
#  if there are 12 green bars in the last 30,
#   I want the median of the highs for only those 12 green bars.


# -----------------------------------
#https://toslc.thinkorswim.com/center/reference/thinkScript/Functions/Tech-Analysis/Median
#Median ( IDataHolder data , int length );   
#Default values:
#length: 12
#Description
# Returns the median value of data for the last length bars.
# Median value is equal to the middle element of ascendingly sorted data set if the number of elements is odd;
#  if the number of elements is even, median value is equal to the average between the two middle elements of ascendingly sorted data set.

#Input parameters
#Parameter    Default value    Description
#data    -    Defines data for which the median value is found.
#length    12    Defines period on which the median value is found.
#Example
#input length = 15;
#plot med = Median(high, length);
#This example script plots a median High price among the last 15 bars.


# The median in math is,
#  the middle value in a set of numbers,
#  when they are arranged in order from least to greatest.
#  If there's an even number of values, the median is the average of the two middle numbers


# find data, set a var true

# calculate the median high,
#  of only green bars,
#   over the last 30 bars.


def na = double.nan;
def bn = barnumber();
#def lastbn = HighestAll(If(IsNaN(close), 0, bn));
#def lastbar = if (bn == lastbn) then 1 else 0;


input bars_back = 30;
# green bar
def grn = close > open;
def grnhi = if grn then high else 0;

# count grn bars within last 30 bars
def grncnt = sum(grn, bars_back);


addlabel(1, "  ", color.black);
addlabel(1, "bars_back " + bars_back , color.yellow);
addlabel(1, "green bars " + grncnt, color.yellow);
addlabel(1, "  ", color.black);

# 2 dbl loops
#  loop1 to floor(grncnt/2) +1
#   loop2  0 to 30,  find min.  then find min > prev
# do again
#  loop1 to floor(grncnt/2) +2
#   loop2  0 to 30,  find min.  then find min > prev


def big = 99999;
def mid1 = fold a = 0 to (floor(grncnt/2)+0)
 with b
 do fold c = 0 to bars_back
  with d = big
  do (if getvalue(grn,c) and getvalue(high,c) > b then min(d, getvalue(high,c)) else d);

addlabel(1, "mid1 " + mid1, color.white);


def mid2 = fold e = 0 to (floor(grncnt/2)+1)
 with f
 do fold g = 0 to bars_back
  with h = big
  do (if getvalue(grn,g) and getvalue(high,g) > f then min(h, getvalue(high,g)) else h);

addlabel(1, "mid2 " + mid2, color.white);


# if grn cnt is even then take avg of 2 #s else use mid2
def midx = if floor(grncnt/2) == (grncnt/2) then ((mid1+mid2)/2) else mid2;

addlabel(1, "median " + midx, color.cyan);


# -------------------------
# test stuff

def xrng = !isnan(close) and isnan(close[-(bars_back+0)]);
input show_grn_hi = yes;
addchartbubble(show_grn_hi and xrng and grn, (high * 1.001), high, color.yellow, yes);

def x = !isnan(close[-(bars_back-1)]) and isnan(close[-(bars_back+0)]);
input show_vert_line = yes;
addverticalline(show_vert_line and x, "-", color.cyan);
#
 

Attachments

  • 00b-odd.JPG
    00b-odd.JPG
    77.8 KB · Views: 90
Solution

Join useThinkScript to post your question to a community of 21,000+ developers and traders.

this looked interesting, so i gave it a try
i always start by rewriting the rules in simple, short , statements
then i verify the question. (look up median.)
then start brainstorming and writing ideas as comments in the code.

i had an idea a double loop would be needed to compare a number to all the choices, over and over,...
if you want the middle number, then need to loop through half the quantity of signals (grncnt)

it finds 2 middle numbers, so if the count is even, it takes the average of them,
if the count is odd, then it uses the 2nd middle number.

draws a vertical line to show the boundary of the bar quantity
bubbles show the green bar highs
labels show the 2 middle numbers, and the median #

Code:
#median_non_conseq_data
# halcyonguy
# 25-08-07

#https://usethinkscript.com/threads/median-function-with-non-contiguous-bars-over-a-range.21382/
#Median function with non-contiguous bars over a range
#hboogie  8/7
#1

#Is it possible to calculate a filtered median or use the median function recursively on a filtered set of data?
# For example, I want to calculate the median high,
#  of only green bars,
#   over the last 30 bars.   (not over the last 30 green bars)

# but for example,
#  if there are 12 green bars in the last 30,
#   I want the median of the highs for only those 12 green bars.


# -----------------------------------
#https://toslc.thinkorswim.com/center/reference/thinkScript/Functions/Tech-Analysis/Median
#Median ( IDataHolder data , int length );  
#Default values:
#length: 12
#Description
# Returns the median value of data for the last length bars.
# Median value is equal to the middle element of ascendingly sorted data set if the number of elements is odd;
#  if the number of elements is even, median value is equal to the average between the two middle elements of ascendingly sorted data set.

#Input parameters
#Parameter    Default value    Description
#data    -    Defines data for which the median value is found.
#length    12    Defines period on which the median value is found.
#Example
#input length = 15;
#plot med = Median(high, length);
#This example script plots a median High price among the last 15 bars.


# The median in math is,
#  the middle value in a set of numbers,
#  when they are arranged in order from least to greatest.
#  If there's an even number of values, the median is the average of the two middle numbers


# find data, set a var true

# calculate the median high,
#  of only green bars,
#   over the last 30 bars.


def na = double.nan;
def bn = barnumber();
#def lastbn = HighestAll(If(IsNaN(close), 0, bn));
#def lastbar = if (bn == lastbn) then 1 else 0;


input bars_back = 30;
# green bar
def grn = close > open;
def grnhi = if grn then high else 0;

# count grn bars within last 30 bars
def grncnt = sum(grn, bars_back);


addlabel(1, "  ", color.black);
addlabel(1, "bars_back " + bars_back , color.yellow);
addlabel(1, "green bars " + grncnt, color.yellow);
addlabel(1, "  ", color.black);

# 2 dbl loops
#  loop1 to floor(grncnt/2) +1
#   loop2  0 to 30,  find min.  then find min > prev
# do again
#  loop1 to floor(grncnt/2) +2
#   loop2  0 to 30,  find min.  then find min > prev


def big = 99999;
def mid1 = fold a = 0 to (floor(grncnt/2)+0)
 with b
 do fold c = 0 to bars_back
  with d = big
  do (if getvalue(grn,c) and getvalue(high,c) > b then min(d, getvalue(high,c)) else d);

addlabel(1, "mid1 " + mid1, color.white);


def mid2 = fold e = 0 to (floor(grncnt/2)+1)
 with f
 do fold g = 0 to bars_back
  with h = big
  do (if getvalue(grn,g) and getvalue(high,g) > f then min(h, getvalue(high,g)) else h);

addlabel(1, "mid2 " + mid2, color.white);


# if grn cnt is even then take avg of 2 #s else use mid2
def midx = if floor(grncnt/2) == (grncnt/2) then ((mid1+mid2)/2) else mid2;

addlabel(1, "median " + midx, color.cyan);


# -------------------------
# test stuff

def xrng = !isnan(close) and isnan(close[-(bars_back+0)]);
input show_grn_hi = yes;
addchartbubble(show_grn_hi and xrng and grn, (high * 1.001), high, color.yellow, yes);

def x = !isnan(close[-(bars_back-1)]) and isnan(close[-(bars_back+0)]);
input show_vert_line = yes;
addverticalline(show_vert_line and x, "-", color.cyan);
#

This is great. I have been trying to modify it to unsuccessfully so far: I want to find the median value for a range of bars that is not based on a rolling length but instead is started and stopped by conditions. For example, like @SleepyZ did here for anchored linear regression dependent on the condition of the triple exhaustion indicator: https://usethinkscript.com/threads/linear-regression-plot-dependent-on-condition.16025/post-128083

I am trying to do something like “find the median high of only the green bars over the range of bars from when condition A became true to when condition B became true” so that the range of the data which is sorted and used to find the median is dynamic. It also requires special handling to do this in the case that over the bar range there is only one sample (eg if the triple exhaustion indicator’s oversold condition was the trigger and it started and stopped after only five bars, and you were finding the median low of only green bars and there was just one, then the correct output would simply be the low of that single bar as the sole data point).

I think it might be very hard to rewrite the logic to do what I’m requesting but I wanted to throw it by you in case it’s not as laborious as I’m imagining and can be achieved with a surgical modification. Thanks for reading and for sharing the original snippet.
 

Similar threads

Not the exact question you're looking for?

Start a new thread and receive assistance from our community.

87k+ Posts
1113 Online
Create Post

Similar threads

Similar threads

The Market Trading Game Changer

Join 2,500+ subscribers inside the useThinkScript VIP Membership Club
  • Exclusive indicators
  • Proven strategies & setups
  • Private Discord community
  • ‘Buy The Dip’ signal alerts
  • Exclusive members-only content
  • Add-ons and resources
  • 1 full year of unlimited support

Frequently Asked Questions

What is useThinkScript?

useThinkScript is the #1 community of stock market investors using indicators and other tools to power their trading strategies. Traders of all skill levels use our forums to learn about scripting and indicators, help each other, and discover new ways to gain an edge in the markets.

How do I get started?

We get it. Our forum can be intimidating, if not overwhelming. With thousands of topics, tens of thousands of posts, our community has created an incredibly deep knowledge base for stock traders. No one can ever exhaust every resource provided on our site.

If you are new, or just looking for guidance, here are some helpful links to get you started.

What are the benefits of VIP Membership?
VIP members get exclusive access to these proven and tested premium indicators: Buy the Dip, Advanced Market Moves 2.0, Take Profit, and Volatility Trading Range. In addition, VIP members get access to over 50 VIP-only custom indicators, add-ons, and strategies, private VIP-only forums, private Discord channel to discuss trades and strategies in real-time, customer support, trade alerts, and much more. Learn all about VIP membership here.
How can I access the premium indicators?
To access the premium indicators, which are plug and play ready, sign up for VIP membership here.
Back
Top