#median_non_conseq_data
# halcyonguy
# 25-08-07
#https://usethinkscript.com/threads/median-function-with-non-contiguous-bars-over-a-range.21382/
#Median function with non-contiguous bars over a range
#hboogie 8/7
#1
#Is it possible to calculate a filtered median or use the median function recursively on a filtered set of data?
# For example, I want to calculate the median high,
# of only green bars,
# over the last 30 bars. (not over the last 30 green bars)
# but for example,
# if there are 12 green bars in the last 30,
# I want the median of the highs for only those 12 green bars.
# -----------------------------------
#https://toslc.thinkorswim.com/center/reference/thinkScript/Functions/Tech-Analysis/Median
#Median ( IDataHolder data , int length );
#Default values:
#length: 12
#Description
# Returns the median value of data for the last length bars.
# Median value is equal to the middle element of ascendingly sorted data set if the number of elements is odd;
# if the number of elements is even, median value is equal to the average between the two middle elements of ascendingly sorted data set.
#Input parameters
#Parameter Default value Description
#data - Defines data for which the median value is found.
#length 12 Defines period on which the median value is found.
#Example
#input length = 15;
#plot med = Median(high, length);
#This example script plots a median High price among the last 15 bars.
# The median in math is,
# the middle value in a set of numbers,
# when they are arranged in order from least to greatest.
# If there's an even number of values, the median is the average of the two middle numbers
# find data, set a var true
# calculate the median high,
# of only green bars,
# over the last 30 bars.
def na = double.nan;
def bn = barnumber();
#def lastbn = HighestAll(If(IsNaN(close), 0, bn));
#def lastbar = if (bn == lastbn) then 1 else 0;
input bars_back = 30;
# green bar
def grn = close > open;
def grnhi = if grn then high else 0;
# count grn bars within last 30 bars
def grncnt = sum(grn, bars_back);
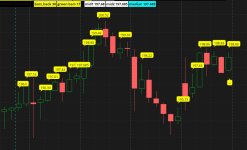
addlabel(1, " ", color.black);
addlabel(1, "bars_back " + bars_back , color.yellow);
addlabel(1, "green bars " + grncnt, color.yellow);
addlabel(1, " ", color.black);
# 2 dbl loops
# loop1 to floor(grncnt/2) +1
# loop2 0 to 30, find min. then find min > prev
# do again
# loop1 to floor(grncnt/2) +2
# loop2 0 to 30, find min. then find min > prev
def big = 99999;
def mid1 = fold a = 0 to (floor(grncnt/2)+0)
with b
do fold c = 0 to bars_back
with d = big
do (if getvalue(grn,c) and getvalue(high,c) > b then min(d, getvalue(high,c)) else d);
addlabel(1, "mid1 " + mid1, color.white);
def mid2 = fold e = 0 to (floor(grncnt/2)+1)
with f
do fold g = 0 to bars_back
with h = big
do (if getvalue(grn,g) and getvalue(high,g) > f then min(h, getvalue(high,g)) else h);
addlabel(1, "mid2 " + mid2, color.white);
# if grn cnt is even then take avg of 2 #s else use mid2
def midx = if floor(grncnt/2) == (grncnt/2) then ((mid1+mid2)/2) else mid2;
addlabel(1, "median " + midx, color.cyan);
# -------------------------
# test stuff
def xrng = !isnan(close) and isnan(close[-(bars_back+0)]);
input show_grn_hi = yes;
addchartbubble(show_grn_hi and xrng and grn, (high * 1.001), high, color.yellow, yes);
def x = !isnan(close[-(bars_back-1)]) and isnan(close[-(bars_back+0)]);
input show_vert_line = yes;
addverticalline(show_vert_line and x, "-", color.cyan);
#