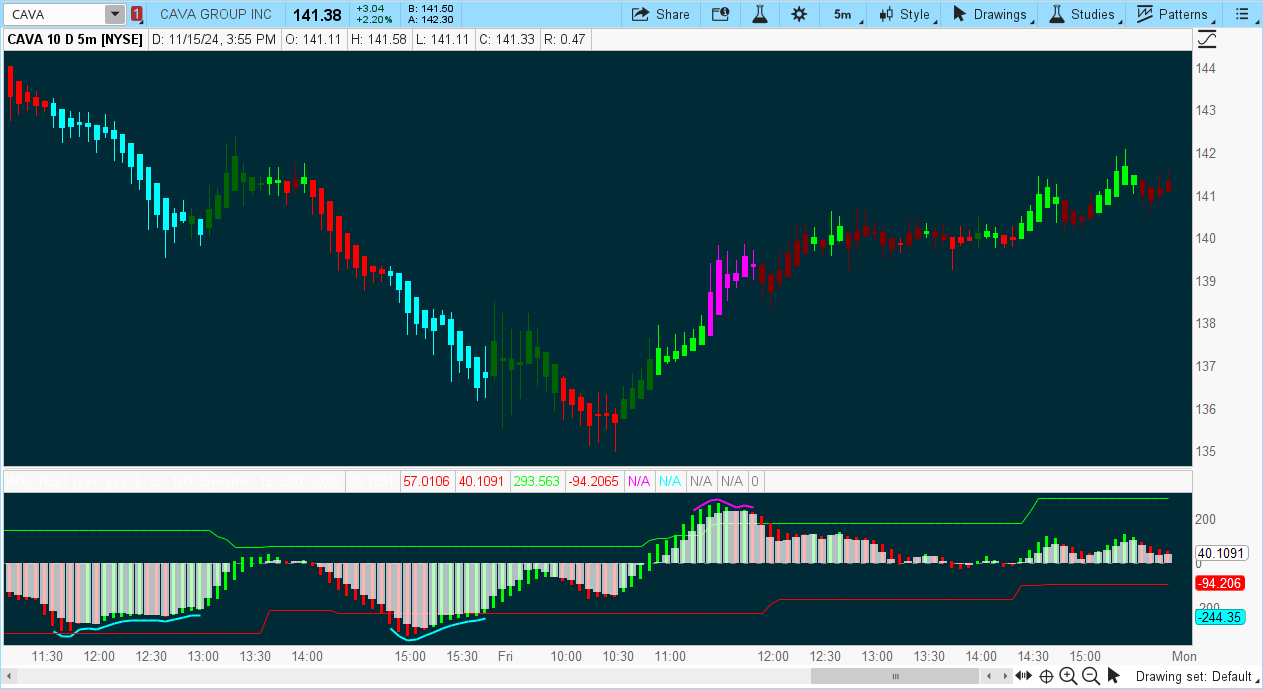
#study("Matrix Mod",shorttitle="MS",precision=1)
# Converted and mod by Sam4Cok@Samer800 - 11/2022 - request from usethinkScript.com memeber
declare lower;
input ColorBars = yes;
input obOsBars = yes;
input Smoother = 5;
input SupResPeriod = 50;
input SupResPercentage = 100;
input BandType = {Default Dynamic, Static};
input PricePeriod = 16;
input Overbought = 200;    # "Overbought"
input Oversold = -200;     # "Oversold"


def na = Double.NaN;
def band = if BandType == BandType.Dynamic then 1 else 0;
#//--Sup/Res Detail

def ys1 = ( high + low + close * 2 ) / 4;
def rk3 = ExpAverage( ys1, Smoother );
def rk4 = StDev(ys1, Smoother);
def rk5 = (ys1 - rk3 ) * 200 / rk4;
def rk6 = ExpAverage( rk5, Smoother );
def up = ExpAverage(rk6, Smoother );
def down = ExpAverage( up, Smoother );
def Oo = If( up < down, up, down );
def Hh = Oo;
def Ll = If( up < down, down, up );
def Cc = Ll;
def vcolor = if Oo > Cc then 0 else if  up > down then 1 else 0;

#// Body Calculations
def bodyHigh = If(up > down, up, down);
def bodyLow = If(Oo < down, up, down);
def body0 = if (up > 0 and down > 0) or (up > 0 and down < 0) then bodyHigh else
            if (up < 0 and down < 0) or (up < 0 and down > 0) then bodyLow else 0;
def body1 = if up < 0 and down > 0 then bodyHigh else if up > 0 and down < 0 then bodyLow else 0;
def bodyCover = if up > 0 and down > 0 then bodyLow else if up < 0 and down < 0 then bodyHigh else 0;
#// Wick Calculations
def wick0 = If(Hh > 0, Hh, Ll);
def wick1 = If(Hh > 0 and Ll < 0, Ll, Hh);
def wickCover = if Hh > 0 and Ll > 0 then Ll else if Hh < 0 and Ll < 0 then Hh else 0;

plot Cover = bodyCover;
Cover.SetPaintingStrategy(PaintingStrategy.SQUARED_HISTOGRAM);
Cover.SetDefaultColor(Color.WHITE);

plot LowerLine = Cc;
LowerLine.SetPaintingStrategy(PaintingStrategy.HISTOGRAM);
LowerLine.AssignValueColor(if vcolor then Color.GREEN else Color.RED);

plot HighLine = Oo;
HighLine.SetPaintingStrategy(PaintingStrategy.HISTOGRAM);
HighLine.AssignValueColor(if vcolor then Color.GREEN else Color.RED);

#//-------S/R Zones------
def Lookback = SupResPeriod;
def PerCent = SupResPercentage;
def Pds = PricePeriod;

def C3 = CCI(Length = Pds);
def Osc = C3;
def Value1 = Osc;
def Value2 = Highest(Value1, Lookback);
def Value3 = Lowest(Value1, Lookback);
def Value4 = Value2 - Value3;
def Value5 = Value4 * (PerCent / 100);
def ResistanceLine = Value3 + Value5;
def SupportLine = Value2 - Value5;

plot dynamicRes = If(band, ResistanceLine, na);
dynamicRes.SetDefaultColor(Color.GREEN);
plot dynamicSup = If(band, SupportLine, na);
dynamicSup.SetDefaultColor(Color.RED);

#//--Overbought/Oversold/Warning Detail
def UPshape = if up > 200 and up > down then Highest(up, 1) + 20 else
              if up > 200 and up < down then Highest(down, 1) + 20 else na;
def DOWNshape = if down < -200 and up > down then Lowest(down, 1) - 20 else
                if down < -200 and up < down then Lowest(up, 1) - 20 else na;

plot UpLine = UPshape;
UpLine.SetDefaultColor(Color.MAGENTA);
UpLine.SetLineWeight(2);
plot DnLine = DOWNshape;
DnLine.SetDefaultColor(Color.CYAN);
DnLine.SetLineWeight(2);

def x1 = If(band or IsNaN(close), na, Overbought);
def x2 = If(band or IsNaN(close), na, Oversold);
plot OverBoughtLine = x1;
OverBoughtLine.SetDefaultColor(Color.GRAY);
OverBoughtLine.SetStyle(Curve.MEDIUM_DASH);
plot OverSoldLine = x2;
OverSoldLine.SetDefaultColor(Color.GRAY);
OverSoldLine.SetStyle(Curve.MEDIUM_DASH);
plot ZeroLine = If(IsNaN(close), na , 0);
ZeroLine.SetDefaultColor(Color.GRAY);
ZeroLine.SetStyle(Curve.SHORT_DASH);

#--- Bar Color

AssignPriceColor(if ! ColorBars then Color.CURRENT else
                 if Oo > 0 then if vcolor then Color.GREEN else Color.DARK_RED else
                                if vcolor then Color.DARK_GREEN else Color.RED);
AssignPriceColor(if !obOsBars then Color.CURRENT else
                 if Oo > 200 then Color.MAGENTA else
                 if Cc < -200 then Color.CYAN else Color.CURRENT);


#---- ENd Code