
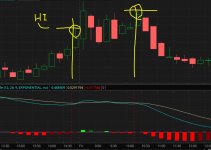
Good morning all, I'm trying to figure out how to call out the high of the period of time between when the MACD crosses under the signal line and when it crosses back above. I'm in IT and have scripting history so can do this logically just can transfer that into ThinkScript without some help. The end-state here is to create a scanner that tells me when the current price action is within a few percent of that so I can pull up that chart. Thanks in advance!
MACD High Variable
- Thread starter shockwave
- Start date
Join useThinkScript to post your question to a community of 21,000+ developers and traders.
| Thread starter | Similar threads | Forum | Replies | Date |
|---|---|---|---|---|
| P | Insert MACD-V into this script? | Questions | 1 | |
| C | A Scan Based Upon the MACD and the ADX Returns Bad Results | Questions | 2 | |
| J | Need MTF for MACD Bands Squeezes | Questions | 1 | |
| B | 50/200 SMA Cross Daily with entry requiring Green MACD Histogram | Questions | 2 | |
| H | MACD crossover scanner | Questions | 3 |
Similar threads
-
-
A Scan Based Upon the MACD and the ADX Returns Bad Results
- Started by craigjjmorrison
- Replies: 2
-
-
50/200 SMA Cross Daily with entry requiring Green MACD Histogram
- Started by brianqw
- Replies: 2
-
The Market Trading Game Changer
Join 2,500+ subscribers inside the useThinkScript VIP Membership Club
- Exclusive indicators
- Proven strategies & setups
- Private Discord community
- ‘Buy The Dip’ signal alerts
- Exclusive members-only content
- Add-ons and resources
- 1 full year of unlimited support
Frequently Asked Questions
What is useThinkScript?
useThinkScript is the #1 community of stock market investors using indicators and other tools to power their trading strategies. Traders of all skill levels use our forums to learn about scripting and indicators, help each other, and discover new ways to gain an edge in the markets.
How do I get started?
We get it. Our forum can be intimidating, if not overwhelming. With thousands of topics, tens of thousands of posts, our community has created an incredibly deep knowledge base for stock traders. No one can ever exhaust every resource provided on our site.
If you are new, or just looking for guidance, here are some helpful links to get you started.
- The most viewed thread:
https://usethinkscript.com/threads/repainting-trend-reversal-for-thinkorswim.183/ - Our most popular indicator:
https://usethinkscript.com/threads/buy-the-dip-indicator-for-thinkorswim.3553/ - Answers to frequently asked questions:
https://usethinkscript.com/threads/answers-to-commonly-asked-questions.6006/
What are the benefits of VIP Membership?
VIP members get exclusive access to these proven and tested premium indicators: Buy the Dip, Advanced Market Moves 2.0, Take Profit, and Volatility Trading Range. In addition, VIP members get access to over 50 VIP-only custom indicators, add-ons, and strategies, private VIP-only forums, private Discord channel to discuss trades and strategies in real-time, customer support, trade alerts, and much more. Learn all about VIP membership here.
How can I access the premium indicators?
To access the premium indicators, which are plug and play ready, sign up for VIP membership here.