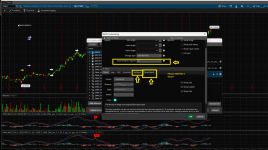
#//@version=4
#https://www.tradingview.com/script/soSwR4mX-MACD-Divergences-by-DaviddTech/
#study(title="MACD Divergences by @DaviddTech",  resolution="")
# Converted by Sam4Cok@Samer800 - 09/2022 - Requested by member from UseThinkscript.com
#// Getting inputs
declare lower;
input fast_length = 12;                # "Fast Length"
input slow_length = 26;                # "Slow Length"
input src = close;                     # "Source"
input signal_length = 9;               # "Signal Smoothing"
input sma_source = {Default EMA, SMA}; # "Oscillator MA Type"
input sma_signal = {Default EMA, SMA}; # "Signal Line MA Type"
input dontTouchZero = yes;             # "Don't touch the zero line?"
#// Plot colors
DefineGlobalColor("macd"       , CreateColor(41,98,255));    # >=90
DefineGlobalColor("signal"     , CreateColor(255,109,0));  # >=80
DefineGlobalColor("grow_above" , CreateColor(38,166,154)); # >=70
DefineGlobalColor("fall_above" , CreateColor(178,223,219)); # >=60
DefineGlobalColor("grow_below" , CreateColor(255,205,210));  # >=50
DefineGlobalColor("fall_below" , CreateColor(255,82,82));   # >=40
#// Calculating
def fast_ma = if sma_source == sma_source.SMA then SimpleMovingAvg(src, fast_length) else
                     ExpAverage(src, fast_length);
def slow_ma = if sma_source == sma_source.SMA then SimpleMovingAvg(src, slow_length) else
                     ExpAverage(src, slow_length);
def macd = fast_ma - slow_ma;
def signal = if sma_signal == sma_signal.SMA then SimpleMovingAvg(macd, signal_length) else
                ExpAverage(macd, signal_length);
def hist = macd - signal;
plot Histogram = hist;   # "Histogram"
Histogram.AssignValueColor(if hist>=0 then
                    if hist[1] < hist then GlobalColor("grow_above") else GlobalColor("fall_above")
               else if hist[1] < hist then GlobalColor("grow_below") else GlobalColor("fall_below"));
Histogram.SetPaintingStrategy(PaintingStrategy.HISTOGRAM);
plot macdLine = macd;    # "MACD"
macdLine.SetDefaultColor(GlobalColor("macd"));
plot SigLine = signal;   # "Signal"
SigLine.SetDefaultColor(GlobalColor("signal"));

#--- Div-----
input lbl = 5;
input lbr  = 5;
input rangeUpper = 60;
input rangeLower = 5;
input DivBull = yes;      # "Plot Bullish"
input DivHiddenBull = no; # "Plot Hidden Bullish"
input DivBear = yes;      # "Plot Bearish"
input DivHiddenBear = no; # "Plot Hidden Bearish"

def divSrc = macd;

def h = high;
def l = low;
script FindPivots {
    input dat = high; # default data or study being evaluated
    input HL  = 0;    # default high or low pivot designation, -1 low, +1 high
    input PF  = 1;    # default pivot forward period
    input PB  = 5;    # default pivot backward period
    ##############
    def _nan;    # used for non-number returns
    def _BN;     # the current barnumber
    def _VStop;  # confirms that the lookforward period continues the pivot trend
    def _V;      # the Value at the actual pivot point
    def _VBar;   # the bar number at the pivot point
    def _PV;     # the previous pivot Value
    def _PVBar;  # the previous pivot bar number
    def _VDiff;  # the difference in values between last two pivot points
    def _VDist;  # the diffence in barnumbers between last two pivot points
    def _VSlope; # the Slope calculated using value and distance changes
    def _VPivot; # used for the pivot point connector line only
    ##############
    _BN  = BarNumber();
    _nan = Double.NaN;
    _VStop =
        fold a = 1 to PF + 1
        with b = 1 while b
        do if HL > 0 then
            dat > GetValue(dat, -a) else
            dat < GetValue(dat, -a) ;
    if (HL > 0) {
        _V = if _BN > PB and dat == Highest(dat, PB) and _VStop
            then dat else _nan;
    } else {
        _V = if _BN > PB and dat == Lowest(dat, PB) and _VStop
            then dat else _nan;
    }
    _VBar   = if !IsNaN(_V) then _BN else _VBar[1];
    _PV     = if !IsNaN(_V) then GetValue(dat, _BN - _VBar[1]) else _PV[1];
    _PVBar  = if   _VBar != _VBar[1]
            then _PVBar[1] else _VBar;
    _VDiff  = AbsValue(_V) - AbsValue(_PV);
    _VDist  = _BN - _PVBar;
    _VSlope = if _V > _PV  then  1 else
              if _V < _PV  then -1 else 0;
    if (HL > 0) {
        _VPivot = _BN >= HighestAll(_PVBar);
    } else {
        _VPivot = _BN >= LowestAll(_PVBar);
    }
    plot result = if !IsNaN(_V) and _VStop then _V else _nan;
}
script valuewhen {
  input cond = 0;
  input pr = 0;
  input n2 = 0;
  def n = n2 + 1;
  def offset2 = fold j = 0 to 200
    with p
    while p < n + 1
    do p + ( if p == n then j - n else if GetValue(cond, j) then 1 else 0 );
  plot price = GetValue(pr, offset2-1);
}
#_inRange(cond) =>
script _inRange {
    input cond = yes;
    input rangeUpper = 60;
    input rangeLower = 5;
        def bars = if cond then 0 else bars[1] + 1;
        def inrange =  (rangeLower <= bars) and (bars <= rangeUpper);
plot retrun = inRange;
}
def ph =  findpivots(divSrc, 1, lbr, lbl);
def pl =  findpivots(divSrc, -1, lbr, lbl);

def phFound = if isNaN(ph) then 0 else 1;
def plFound = if isNaN(pl) then 0 else 1;

def vhFound = valuewhen(phFound, divSrc, 1);
def vlFound = valuewhen(plFound, divSrc, 1);

def phPrice = valuewhen(phFound, h, 1);
def plPrice = valuewhen(plFound, l, 1);

#// Regular Bullish
def oscHL = divSrc > vlFound and _inRange(plFound[1],rangeUpper,rangeLower) and divSrc < 0;
def priceLL = l < plPrice;
def priceHHZero = highest(divSrc, lbL+lbR+5);
def blowzero = if donttouchzero then priceHHZero < 0 else yes;
def bullCond = DivBull and plFound and oscHL and priceLL and blowzero;
#// Hidden Bullish
def oscLL = divSrc < vlFound and  _inRange(plFound[1],rangeUpper,rangeLower) and divSrc < 0;
def priceHL = l > plPrice;
def hiddenBullCond = DivHiddenBull and plFound and oscLL and priceHL and blowzero;

#// Regular Bearish
def oscLH   = divSrc < vhFound and _inRange(phFound[1],rangeUpper,rangeLower) and divSrc > 0;
def priceHH = h > phPrice;
def priceLLZero =  lowest(divSrc, lbL+lbR+5);
def bearzero = if donttouchzero then priceLLZero > 0 else yes;
def bearCond = DivBear and phFound and oscLH and priceHH and bearzero;
#// Hidden Bearish
def oscHH = divSrc > vhFound and  _inRange(phFound[1],rangeUpper,rangeLower) and divSrc > 0;
def priceLH = h < phPrice;
def hiddenBearCond = DivHiddenBear and phFound and oscHH and priceLH and bearzero;

addchartbubble(bullCond, divSrc, "R", color.green, no);
addchartbubble(bearCond, divSrc, "R", color.red, yes);
addchartbubble(hiddenBullCond, divSrc, "H", color.DARK_green, no);
addchartbubble(hiddenBearCond, divSrc, "H", color.DARK_red, yes);

#---- END

