High of price action statically

Runwme

New member
VIP
Big thanks to you guys. Ive learned so much and improved my day trading

My biggest loses occur when Im not actively watching the stock whether it is because night time and Im sleeping when a tweet gets posted that adds volatility to the market
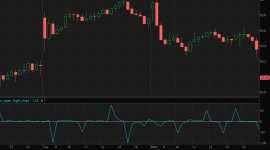
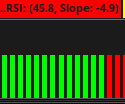
I wrote a ahk Auto hot key script that uses atr and rsi to exit positions for me if Im not actively watching.

It acts like a trailing stop but it works 24hrs a day. The problem I have is that during the evening, when market is running flat, the ema or atr gets closer and closer to the price action and a change of only a few cents can trigger it.

The good thing about using ahk versus a trailing stop is that I can adjust the time delay seeing the price action so that momentary blips down dont take me out of trade prematurely by using 2000ms of seeing sell signal continuously before triggering the sell.

I tried searching usethinkscript, but perhaps I wasn't using the correct search

My question is this...
Is there an indicator now or can one be created that looks at the high of price action statically (not a moving average ) and triggers a label of say 10cents if the price action is moving up, then reverses? For night time, it would be especially helpful for exiting positions.
 
Last edited:
Solution
My apologies, my lack of knowing the correct terminology is perhaps the reason my searches haven't been fruitful. Im working on it.


Currently Im using RSI and atr that both change instantly as the price moves up and down within say a 1 min time frame and adjusts in real time.

Correct me if Im misunderstanding you, what I understand you're saying, is say a price during a 1 min interval is 9.75 at open, 10.00 mid way and 9.50 at close, there is no way to use the 10.00 as high point of the price to turn a label red if price drops say 10 cents from the high and use as basis for a stop loss?

That price unlike rsi is only available at the close of time interval?
no apologies needed.

what is midway? timewise or...
learn to use proper terms when asking questions. 'price action' has no meaning.

are you asking,..
during the current bar,
look for when close is rising , then falling ?

the close rises and falls, in almost every bar, on every symbol... you would need to be a lot more specific , price change over what time period.

regarding time charts,
but it doesn't matter. we can't read data and save it, during a bar. close is changing during the current bar, but once the bar closes, we can only read the final value. if the chart time is 1 minute, we can't read a value at 15 seconds into the bar and save it. 1 minute is the smallest time increment.

i don't use tick charts, so not sure what is possible with them.
My apologies, my lack of knowing the correct terminology is perhaps the reason my searches haven't been fruitful. Im working on it.


Currently Im using RSI and atr that both change instantly as the price moves up and down within say a 1 min time frame and adjusts in real time.

Correct me if Im misunderstanding you, what I understand you're saying, is say a price during a 1 min interval is 9.75 at open, 10.00 mid way and 9.50 at close, there is no way to use the 10.00 as high point of the price to turn a label red if price drops say 10 cents from the high and use as basis for a stop loss?

That price unlike rsi is only available at the close of time interval?
 
Last edited:
@Runwme Interesting concept... Unfortunately, without seeing the code you are working with it will be hard for us to help improve your logic to account for those low volume after hours periods...
This is the code Im currently using, during day when volatile and going off momentum, I set the atr factor to 0.5. After hours I raise that to 3.0


Code:
declare lower;

input rsiLength = 14;
input rsiOversold = 40;
input rsiOverbought = 60;

input bbLength = 20;
input bbMult = 1.0;

input volLength = 20;
input relVolHigh = 1.5;

input ATRPeriod = 9;
input ATRFactor = 0.5;
# === RSI ===
def rsi = RSI(length = rsiLength);
def rsiBuy = rsi < rsiOversold;
def rsiSell = rsi > rsiOverbought;

# === Bollinger Bands ===
def basis = Average(close, bbLength);
def bbBuy = high < basis;
def bbSell = low > basis;

# === Relative Volume ===
def avgVol = Average(volume, volLength);
def relVol = if avgVol != 0 then volume / avgVol else 0;

# ✅ FIX: Volume should only confirm directionally
def volBuy = relVol > relVolHigh and (rsiBuy or bbBuy);
def volSell = relVol > relVolHigh and (rsiSell or bbSell);

# === BUY Stack ===
def buy1 = if rsiBuy then 1 else 0;
def buy2 = buy1 + (if bbBuy then 1 else 0);
def buy3 = buy2 + (if volBuy then 1 else 0);

# === SELL Stack ===
def sell1 = if rsiSell then -1 else 0;
def sell2 = sell1 + (if bbSell then -1 else 0);
def sell3 = sell2 + (if volSell then -1 else 0);


def rsiSlope = rsi - rsi[1];
AddLabel(yes,
    "......RSI: (" + Round(rsi, 1) + ", Slope: " +Round(rsiSlope, 1) +")",
    if (rsi >40 and rsislope > 2)  then Color.GREEN
    else if rsislope < -2 then Color.RED
    else Color.GRAY
);

# === Total Confluence Score ===
#def totalConfluence = buy3 + sell3;
#AddLabel(yes,
#    "Confluence Score: " + totalConfluence,
#    if totalConfluence >= 2 then Color.GREEN
#    else if totalConfluence <= -2 then Color.RED
 #   else Color.LIGHT_GRAY
#);
# === Labels (Fixed Color) ===
#AddLabel(yes,
#    "RSI: " + Round(rsi, 1) +
#    (if rsiBuy then " ⬅️ < 40 (Buy)" else if rsiSell then #" ⬆️ > 60 (Sell)" else ""),
#    Color.MAGENTA
#);
#AddLabel(yes,
#    "BB Basis: " + Round(basis, 2) +
#    (if bbBuy then " ⬅️ High < Basis" else if bbSell then #" ⬆️ Low > Basis" else ""),
 #   Color.CYAN
#);

AddLabel(yes,
    "RelVol: " + Round(relVol, 2) +
    (if volBuy and !volSell then " ✅ Buy Confirm"
     else if volSell then " 🔻 Sell Confirm"
     else ""),
    Color.YELLOW
);


#Below this line is original
input trailType = {default modified, unmodified};

input firstTrade = {default long, short};
input averageType = AverageType.EXPONENTIAL;
input priceActionIndicator = close;


Assert(ATRFactor > 0, "'atr factor' must be positive: " + ATRFactor);

def HiLo = Min(high - low, 1.5 * Average(high - low, ATRPeriod));
def HRef = if low <= high[1]
    then high - close[1]
    else (high - close[1]) - 0.5 * (low - high[1]);
def LRef = if high >= low[1]
    then close[1] - low
    else (close[1] - low) - 0.5 * (low[1] - high);

def trueRange;
switch (trailType) {
case modified:
    trueRange = Max(HiLo, Max(HRef, LRef));
case unmodified:
    trueRange = TrueRange(high, close, low);
}
def loss = ATRFactor * MovingAverage(averageType, trueRange, ATRPeriod);

def state = {default init, long, short};
def trail;
switch (state[1]) {
case init:
    if (!IsNaN(loss)) {
        switch (firstTrade) {
        case long:
            state = state.long;
            trail =  close - loss;
        case short:
            state = state.short;
            trail = close + loss;
        }
    } else {
        state = state.init;
        trail = Double.NaN;
    }
case long:
    if (close > trail[1]) {
        state = state.long;
        trail = Max(trail[1], close - loss);
    } else {
        state = state.short;
        trail = close + loss;
    }
case short:
    if (close < trail[1]) {
        state = state.short;
        trail = Min(trail[1], close + loss);
    } else {
        state = state.long;
        trail =  close - loss;
    }
}

def BuySignal = Crosses(state == state.long, 0, CrossingDirection.ABOVE);
def SellSignal = Crosses(state == state.short, 0, CrossingDirection.ABOVE);


AddLabel(yes, if Buysignal then "..BullishTrend" else if sellsignal then "..bearTrend" else "..N/A", if buysignal then color.green else if sellsignal then color.red else color.gray);

plot TrailingStop = 49;

TrailingStop.SetPaintingStrategy(PaintingStrategy.POINTS);
TrailingStop.DefineColor("Buy", color.red);
TrailingStop.DefineColor("Sell", color.green);
TrailingStop.AssignValueColor(if state == state.long
    then TrailingStop.Color("Sell")
    else TrailingStop.Color("Buy"));

And this is the ahk portion of the script that looks for in 2 places ( rsi and atr) to be red for 2 seconds continuously before exiting the position for me if Im not at the desk.

TrueColor := colourMatches(0xff0000, [459, 949], [42,901])
IF TrueColor And !Time
Time := A_TickCount + 2000 ; + 2 seconds
Else IF !TrueColor And Time
Time := False
Sleep(100)
} Until Time And (A_TickCount > Time) ; match consistently for 5 seconds
lclick(5, [769, 200], [1522, 174], [1522, 505])


What Id rather it do is instead of looking at atr, that it looks at the highest point in the candle, then subtracts a fixed amount, say 1% or .20 cents for a stoploss before triggering the exit label.
 
My apologies, my lack of knowing the correct terminology is perhaps the reason my searches haven't been fruitful. Im working on it.


Currently Im using RSI and atr that both change instantly as the price moves up and down within say a 1 min time frame and adjusts in real time.

Correct me if Im misunderstanding you, what I understand you're saying, is say a price during a 1 min interval is 9.75 at open, 10.00 mid way and 9.50 at close, there is no way to use the 10.00 as high point of the price to turn a label red if price drops say 10 cents from the high and use as basis for a stop loss?

That price unlike rsi is only available at the close of time interval?
no apologies needed.

what is midway? timewise or pricewise? just throwing questions back at you to help you rethink how you are wording things.

is 10 = the high ? or just some price level between the high and low? if 10 is somewhere between the high and low, then , no, you can't read and save that price.
open,high,low,close are the only candle parameters that can be read. high and low can change while the candle is the current candle.


we could calc the difference from open to high. then the difference of high to close. then compare them as a ratio....

after writing that, i wrote this....
take a look at this and experiment with it. the bigger the spike, the better chance of a move

Code:
#ratios_open_high_close

#https://usethinkscript.com/threads/low-of-price-action-statically.21097/#post-153610

# compare open.high / high.close   as a ratio
# depends if green or red

declare lower;

def na = double.nan;
def bn = barnumber();

def o = open;
def h = high;
def l = low;
def c = close;
def grn = c > o;
def red = c < o;
def maxratio = 100.0;
def y1 = 0.001;

#  up candle
def ohup = max(y1, (h - o));
def hcup = max(y1, (h - c));
def ratioup = if ohup/hcup > maxratio then maxratio else ohup/hcup;

# down candle
def oldwn = max(y1, (o - l));
def lcdwn = max(y1, (c - l));
def ratiodwn = if oldwn/lcdwn > maxratio then maxratio else oldwn/lcdwn;

plot z = if grn then ratioup else if red then -ratiodwn else 0;
z.SetDefaultColor(Color.cyan);
#z.setlineweight(1);
z.hidebubble();

plot z0 = 0;
z0.SetDefaultColor(Color.light_gray);
#z0.setlineweight(1);
z0.hidebubble();

addchartbubble(0, -100,
 ohup + "\n" +
 hcup + "\n" +
 ratioup
, color.yellow, no);
#
 

Attachments

  • img1.JPG
    img1.JPG
    77.6 KB · Views: 31
Solution
no apologies needed.

what is midway? timewise or pricewise? just throwing questions back at you to help you rethink how you are wording things.

is 10 = the high ? or just some price level between the high and low? if 10 is somewhere between the high and low, then , no, you can't read and save that price.
open,high,low,close are the only candle parameters that can be read. high and low can change while the candle is the current candle.


we could calc the difference from open to high. then the difference of high to close. then compare them as a ratio....

after writing that, i wrote this....
take a look at this and experiment with it. the bigger the spike, the better chance of a move

Code:
#ratios_open_high_close

#https://usethinkscript.com/threads/low-of-price-action-statically.21097/#post-153610

# compare open.high / high.close   as a ratio
# depends if green or red

declare lower;

def na = double.nan;
def bn = barnumber();

def o = open;
def h = high;
def l = low;
def c = close;
def grn = c > o;
def red = c < o;
def maxratio = 100.0;
def y1 = 0.001;

#  up candle
def ohup = max(y1, (h - o));
def hcup = max(y1, (h - c));
def ratioup = if ohup/hcup > maxratio then maxratio else ohup/hcup;

# down candle
def oldwn = max(y1, (o - l));
def lcdwn = max(y1, (c - l));
def ratiodwn = if oldwn/lcdwn > maxratio then maxratio else oldwn/lcdwn;

plot z = if grn then ratioup else if red then -ratiodwn else 0;
z.SetDefaultColor(Color.cyan);
#z.setlineweight(1);
z.hidebubble();

plot z0 = 0;
z0.SetDefaultColor(Color.light_gray);
#z0.setlineweight(1);
z0.hidebubble();

addchartbubble(0, -100,
 ohup + "\n" +
 hcup + "\n" +
 ratioup
, color.yellow, no);
#

Yes , you are correct, I should have said 10 was the high pricewise of the candle, not midway.

Let me see if I can articulate it better ( Im on second cup of coffee, so chances are better)

Here is what Im looking for, and I appreciate your help. I'm happy to pay you for your time creating it.


Currently it works pretty good during market regular hours with tight 0.5 ATR factor when there is a lot of volatility, in afterhours I have to set atr factor very high to keep it from churning, and it loses its efficacy.

My current setup is now looking at rsi rsislope and atr to trigger buy/sell signals as it watches for a pixel within the label to remain green or red for 2000ms ( remaining on for 2000ms eliminates a momentary dip triggering prematurely)
when this is true, ahk triggers a buy or sell by sending ctrl while clicking on active trader to allow an offset and better chance at complete fill in afterhours.


Ideally, it would work like TOS TRG w/bracket set up as an adjustable trailing stoploss from the high, but instead of automatically executing the order, it turns a label red, which my autohotkey will then trigger a sell of my position, effectively working as trailing stoploss in the afterhours.

example of how I see it working
Tqqq is trending from 68.17 to a high of 68.25, if the trigger input is set 10 cents below the high price, then at 68.15 a label "sell" will light up red.
 

Attachments

  • rsiandatr.png
    rsiandatr.png
    1.9 KB · Views: 19
Last edited:

Join useThinkScript to post your question to a community of 21,000+ developers and traders.

Similar threads

Not the exact question you're looking for?

Start a new thread and receive assistance from our community.

87k+ Posts
430 Online
Create Post

Similar threads

Similar threads

The Market Trading Game Changer

Join 2,500+ subscribers inside the useThinkScript VIP Membership Club
  • Exclusive indicators
  • Proven strategies & setups
  • Private Discord community
  • ‘Buy The Dip’ signal alerts
  • Exclusive members-only content
  • Add-ons and resources
  • 1 full year of unlimited support

Frequently Asked Questions

What is useThinkScript?

useThinkScript is the #1 community of stock market investors using indicators and other tools to power their trading strategies. Traders of all skill levels use our forums to learn about scripting and indicators, help each other, and discover new ways to gain an edge in the markets.

How do I get started?

We get it. Our forum can be intimidating, if not overwhelming. With thousands of topics, tens of thousands of posts, our community has created an incredibly deep knowledge base for stock traders. No one can ever exhaust every resource provided on our site.

If you are new, or just looking for guidance, here are some helpful links to get you started.

What are the benefits of VIP Membership?
VIP members get exclusive access to these proven and tested premium indicators: Buy the Dip, Advanced Market Moves 2.0, Take Profit, and Volatility Trading Range. In addition, VIP members get access to over 50 VIP-only custom indicators, add-ons, and strategies, private VIP-only forums, private Discord channel to discuss trades and strategies in real-time, customer support, trade alerts, and much more. Learn all about VIP membership here.
How can I access the premium indicators?
To access the premium indicators, which are plug and play ready, sign up for VIP membership here.
Back
Top