I'm looking for an indicator that shows two ticker's lines offset by a period of time. Such as LOW and HD, show both lines on the chart but delay LOW 14 days on the assumption that LOW will follow HD somewhat but 14 days later. This may already exist and I just can't think of the right name to use for a search.
I'm looking for an indicator that shows two ticker's lines offset by a period of time. Such as LOW and HD, show both lines on the chart but delay LOW 14 days on the assumption that LOW will follow HD somewhat but 14 days later. This may already exist and I just can't think of the right name to use for a search.
sorry, i am confused by your wording.
what is a ticker line?
what is HD? don't use abbreviations, spell it out.
i guess you want to plot and shift a high line and a low line?
here is something to experiment with.
it uses an offset number to shift the plots.
use a positive number to shift a line to the right. (it reads values from past bars)
use a negative number to shift a line to the left. (it reads values from future bars)
Yeah, I struggled with how to search for the idea, much less how to actually describe it. This is what I was trying to do but I did leave out that the offset lines need to be inverse. How would I do that? I'm trying to map out an inverse correlation based on a set time delay. The extended or offset inverted line would show me where I hoped my target underlying was going. Thank you for your quick help. I'll try to dig up how to invert the line, but you guys make me look like the ***** step child when it comes to this stuff.
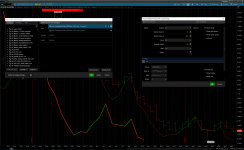
The following chart shows HD (Home Depot) compared with a LOW (Lowe's Companies) script with 2 lines (one with 0 days displacement and line width of 1, second with 14 days displacement and line width of 3)):
Both HD and LOW track similarly.
I see in your new post you want the inverse of LOW:
Change in the script to: plot s = 1 / symbol[displaceLength];
Are you wanting to move/shift the 14 day displacement forward to match the same time with HD?
There are extra options (labels, bubble with move, cloud) included in script (attaches in lower grid, move to upper, if needed):
Code:
declare lower;

input bubble         = no;
input bubbleMoveH    = 0;   # bubble Move Horizontal
input bubbleMoveV    = 0.0; # bubble Move Vertical
input cloud          = no;
input DisplaceLength = 0;
input label          = yes;
input Length         = 1;

def symbol = close("LOW");

plot s = symbol[displaceLength];
s.DefineColor("Up", GetColor(6));
s.DefineColor("Down", GetColor(5));
s.AssignValueColor(if s > s[1] then s.Color("Up") else s.Color("Down"));
s.SetLineWeight(1);
s.SetStyle(1);
s.HideBubble();
s.HideTitle();

def data = if isNaN(s) then data[1] else s + bubbleMoveV * TickSize();
def x    = !IsNaN(close[(0+(+bubbleMoveH))]) and IsNaN(close[(-1+(+bubbleMoveH))]);
def y    = data;

AddChartBubble(Bubble and x, y,
 symbol + " " + Round(y, 2),
 s.TakeValueColor(),
 if s > s[1] then yes else no);

def k = 0;
def bubline = IsNaN(close[k]) and !IsNaN(close[bubbleMoveH + 0]);
def w = if (bubble and !IsNaN(close[k]) and IsNaN(close[k - 1])) then s[k] else if bubline then w[1] else double.NaN;

plot zw = w;
zw.SetDefaultColor(Color.GRAY);
zw.SetLineWeight(1);
zw.HideBubble();
zw.HideTitle();

AddLabel(label, if s > s[1] then
 " LOW                                                                                                "
 else
 "                                                                                                LOW ",
 if s > s[1] then color.GREEN else color.RED);

def hiLevel = if s >= s[-1] then Double.POSITIVE_INFINITY else Double.NEGATIVE_INFINITY;
AddCloud(if cloud and -hiLevel then -hiLevel else double.NaN, hiLevel, color.GREEN, color.RED);
The following chart shows HD (Home Depot) compared with a LOW (Lowe's Companies) script with 2 lines (one with 0 days displacement and line width of 1, second with 14 days displacement and line width of 3)):
This does it but when I set the offset to 21, I get the offset to May 31 which is 29. Obviously I'm doing something wrong. Set displace to 15 and it hits properly on 5/23.
This does it but when I set the offset to 21, I get the offset to May 31 which is 29. Obviously I'm doing something wrong. Set displace to 15 and it hits properly on 5/23. View attachment 21765
That makes sense, it is using bars and doesn't draw a bar for non trading days. Is there a way to use calendar days in the offset, instead of trading days? I can adjust it when I use it but I'm just being nitpicky here, I wouldn't have gotten this far without you two (@Carl-not-Karl and @halcyonguy) helping. VIP membership here has definitely been worth the subscription.
That makes sense, it is using bars and doesn't draw a bar for non trading days. Is there a way to use calendar days in the offset, instead of trading days? I can adjust it when I use it but I'm just being nitpicky here, I wouldn't have gotten this far without you two (@Carl-not-Karl and @halcyonguy) helping. VIP membership here has definitely been worth the subscription.
Looking at ToS Learning Center there is no return on a search for "calendar".
As the ToS Chart and associated indicators use a Chart type (candle, bar, etc.) it needs that time (tick, minute, day, etc.) to function/return the data.
Someone more experienced than I may have a better answer or solution for you.
G/L
No sweat. What I have is great. I'll just have to adjust it manually. And I'll keep searching for a work around, I didn't come up with anything for it while I was searching earlier either but I'm curious about it now. Thanks again for your help.
The following chart shows HD (Home Depot) compared with a LOW (Lowe's Companies) script with 2 lines (one with 0 days displacement and line width of 1, second with 14 days displacement and line width of 3)):
This is working for me but I would like to use it to look for other correlations. But I can't figure out how to add a menu box for the ticker so I can change it from LOW to something else without going into the thinkscript each time. It seems it should be easy but I can't find an example of what I want so don't know what I'm doing wrong. I just want to be able to select the ticker in the study parameters (customizing) box. Please advise.
This is working for me but I would like to use it to look for other correlations. But I can't figure out how to add a menu box for the ticker so I can change it from LOW to something else without going into the thinkscript each time. It seems it should be easy but I can't find an example of what I want so don't know what I'm doing wrong. I just want to be able to select the ticker in the study parameters (customizing) box. Please advise.
useThinkScript is the #1 community of stock market investors using indicators and other tools to power their trading strategies. Traders of all skill levels use our forums to learn about scripting and indicators, help each other, and discover new ways to gain an edge in the markets.
How do I get started?
We get it. Our forum can be intimidating, if not overwhelming. With thousands of topics, tens of thousands of posts, our community has created an incredibly deep knowledge base for stock traders. No one can ever exhaust every resource provided on our site.
If you are new, or just looking for guidance, here are some helpful links to get you started.
VIP members get exclusive access to these proven and tested premium indicators: Buy the Dip, Advanced Market Moves 2.0, Take Profit, and Volatility Trading Range. In addition, VIP members get access to over 50 VIP-only custom indicators, add-ons, and strategies, private VIP-only forums, private Discord channel to discuss trades and strategies in real-time, customer support, trade alerts, and much more. Learn all about VIP membership here.
How can I access the premium indicators?
To access the premium indicators, which are plug and play ready, sign up for VIP membership here.