
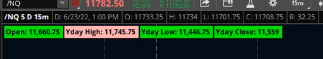
I am looking for this indicator with plots open ,yday high, yday low, yday close.
Depending on where the price on the current day if it is above or below they will change from green to red.
Does anyone have this indicator they can share or can code one?
How would I get it to plot the labels like in the pic attached?
Depending on where the price on the current day if it is above or below they will change from green to red.
Does anyone have this indicator they can share or can code one?
How would I get it to plot the labels like in the pic attached?
Attachments
Last edited by a moderator: