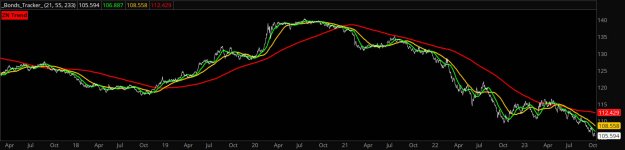
Lots of talk about bonds lately. Sell-off in bonds has made the interest rates rise. Surges in Bonds make SPX rise. SPX and Bonds seem to be highly correlated these days. This is a lower study. Hope this is useful to someone.
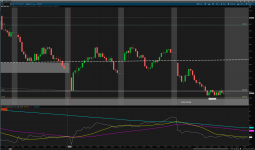
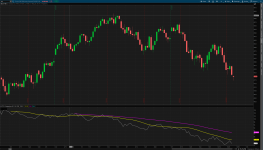
I have attached a day chart for /ES and a 15 minute chart for SPX. Note the moving average lag problem doesn't show up with SPX - don't know why. Note, with the 15 minute SPX chart that a rise in bonds can push up SPX and a drop in bonds can presage a big daily drop in SPX. Bonds are not the only force guiding the market but are an important consideration.
I have attached a day chart for /ES and a 15 minute chart for SPX. Note the moving average lag problem doesn't show up with SPX - don't know why. Note, with the 15 minute SPX chart that a rise in bonds can push up SPX and a drop in bonds can presage a big daily drop in SPX. Bonds are not the only force guiding the market but are an important consideration.
Code:
#JS_TLT_Comparison
#plots the TLT with three averages
#be sure to set it up on the Left Axis if overlaying price

declare lower;

input Period1 = 21;
input Period2 = 55;
input Period3 = 233;

plot tlt = Close("TLT");

tlt.SetPaintingStrategy(paintingStrategy.Line);
tlt.SetLineWeight(1);
tlt.SetDefaultColor(Color.white);

plot TltAvg1 = Average(tlt, Period1);

TltAvg1.SetPaintingStrategy(paintingStrategy.Line);
TltAvg1.SetLineWeight(2);
TltAvg1.SetDefaultColor(Color.magenta);

plot TltAvg2 = Average(tlt, Period2);

TltAvg2.SetPaintingStrategy(paintingStrategy.Line);
TltAvg2.SetLineWeight(2);
TltAvg2.SetDefaultColor(Color.cyan);

plot TltAvg3 = Average(tlt, Period3);

TltAvg3.SetPaintingStrategy(paintingStrategy.Line);
TltAvg3.SetLineWeight(2);
TltAvg3.SetDefaultColor(Color.magenta);

def rising = tlt > TltAvg1 and TltAvg1 > TltAvg2 and TltAvg2 > TltAvg3;

def falling = tlt < TltAvg1 and TltAvg1 < TltAvg2 and TltAvg2 < TltAvg3;

AddLabel(yes, "TLT Trend", if rising then color.light_green else if falling then color.light_red else color.yellow);
Attachments
Last edited:
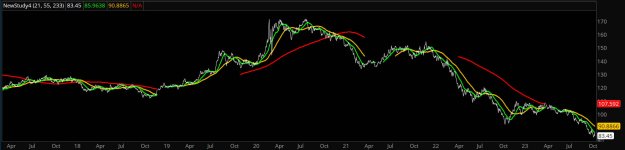
 I attached a screenshot for your review...