
Author Message:
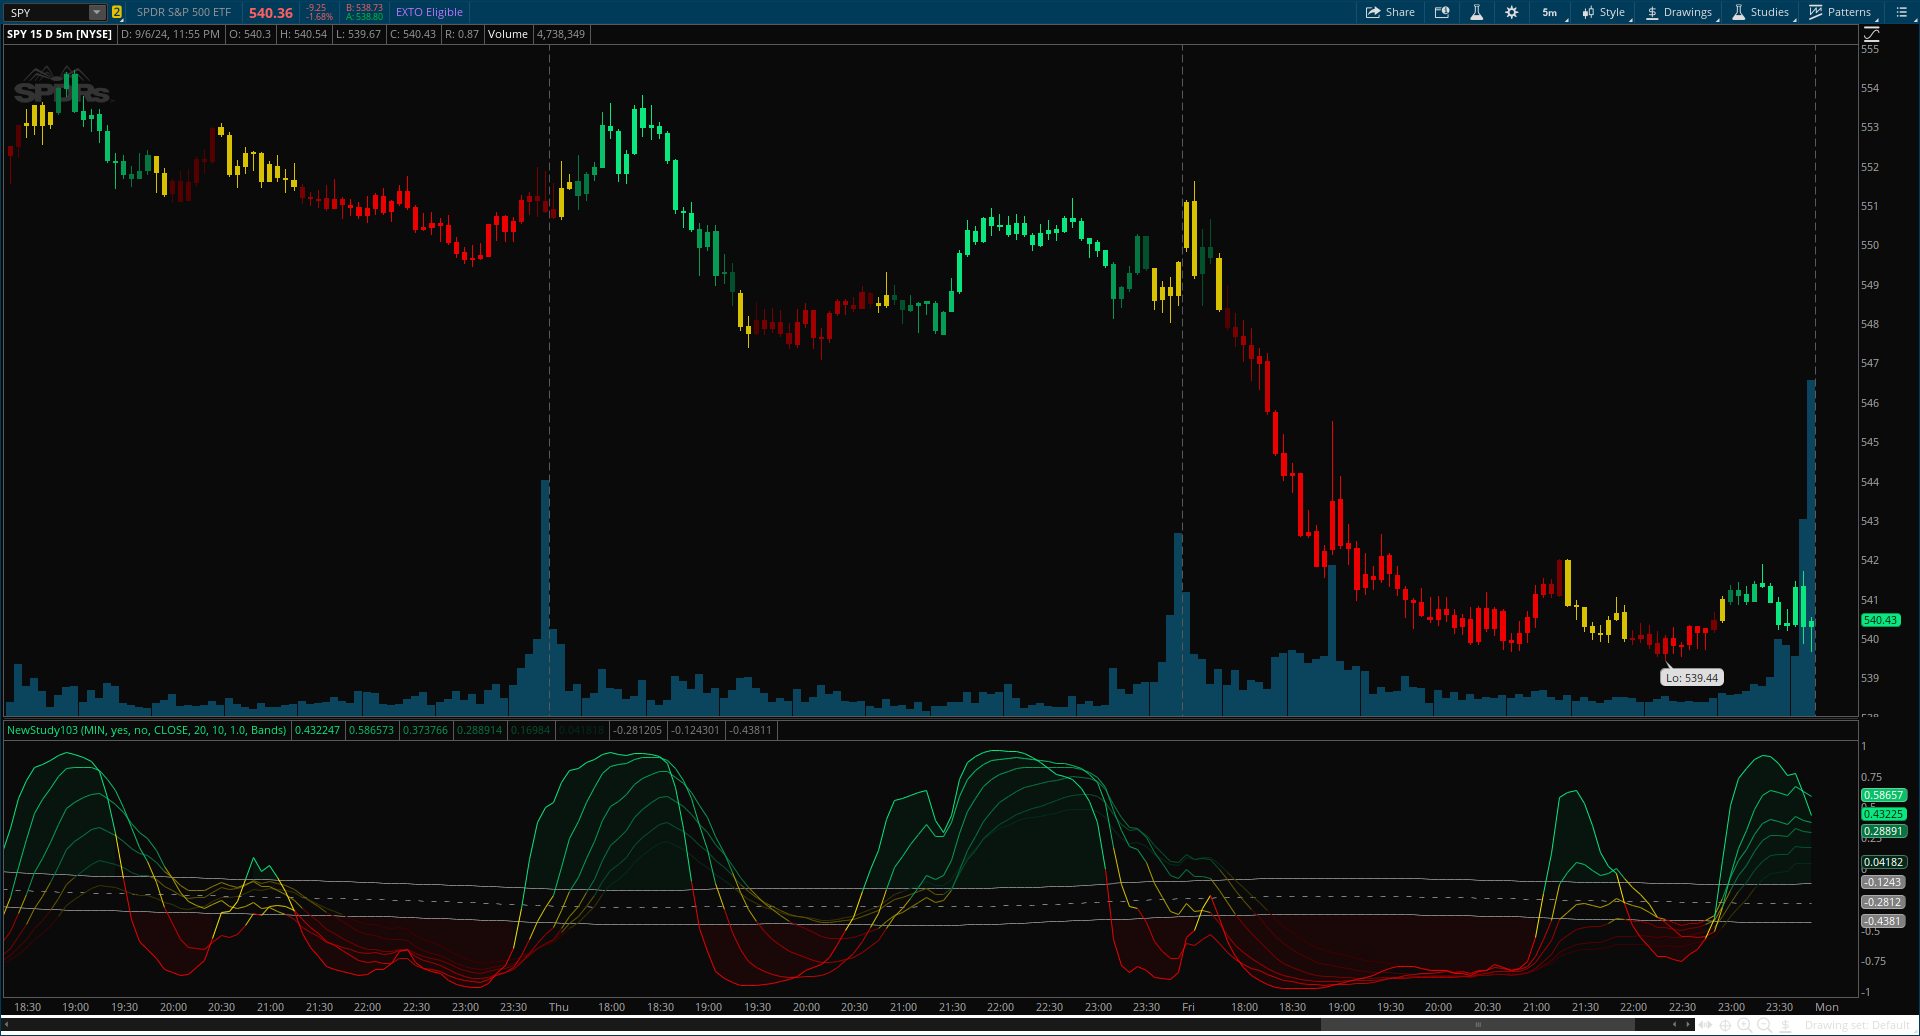
The Inverse Fisher Oscillator is a powerful tool for identifying market trends and potential reversal points by applying the Inverse Fisher Transform to normalized price data. This indicator plots multiple smoothed oscillators, each color-coded to signify their relation to dynamic volatility bands. Additionally, the Butterworth filter is incorporated to further refine trend signals.
CODE:
CSS:
#// Indicator for TOS
#// © BigBeluga
#indicator("Inverse Fisher Oscillator [BigBeluga]")
# Converted by Sam4Cok@Samer800    - 09/2024

declare lower;
input timeframe = AggregationPeriod.MIN;
input colorBars = yes;
input showLabel = no;
input source = FundamentalType.CLOSE;
input Length  = 20; #, "Length")  // Input for the length of the normalization period
input Smooth  = 10; #, "Smooth")  // Input for the smoothing period
input multi    = 1.0; #, "Bands Multiplier")  // Multiplier for the volatility bands
input MidLineType =  {default "Bands", "Simple"}; # "Mid Line Type:"

def na = Double.NaN;
def last = IsNaN(close);
def current = GetAggregationPeriod();
def tf = Max(current, timeframe);
def src = Fundamental(FundamentalType = source, Period = tf);

#-- colors
DefineGlobalColor("band", Color.GRAY);
DefineGlobalColor("top1", CreateColor(10, 231, 127));
DefineGlobalColor("top2", CreateColor(8, 193, 106));
DefineGlobalColor("top3", CreateColor(7, 156, 86));
DefineGlobalColor("top4", CreateColor(5, 118, 65));
DefineGlobalColor("top5", CreateColor(3, 81, 44));
DefineGlobalColor("top6", CreateColor(2, 43, 24));
DefineGlobalColor("mid1", CreateColor(254, 228, 0));
DefineGlobalColor("mid2", CreateColor(215, 193, 0));
DefineGlobalColor("mid3", CreateColor(176, 158, 0));
DefineGlobalColor("mid4", CreateColor(136, 123, 0));
DefineGlobalColor("mid5", CreateColor(97, 87, 0));
DefineGlobalColor("mid6", CreateColor(58, 52, 0));
DefineGlobalColor("btm1", CreateColor(239, 0, 0));
DefineGlobalColor("btm2", CreateColor(200, 0, 0));
DefineGlobalColor("btm3", CreateColor(161, 0, 0));
DefineGlobalColor("btm4", CreateColor(121, 0, 0));
DefineGlobalColor("btm5", CreateColor(82, 0, 0));
DefineGlobalColor("btm6", CreateColor(62, 0, 0));

#// Method to calculate the inverse Fisher transform
script inverse_fisher {
    input src = close;
    input Length = 20;
    input Smooth = 10;
    def avg = Sum(src, Length) / Length;
    def norm_price = (src - avg) / StDev(src, Length);
    def smWMA = WMA(norm_price, Smooth);
    def norm = (Exp(2 * smWMA) - 1) ;
    def dnor = (Exp(2 * smWMA) + 1);
    def inverse_fisher = norm / dnor;
    plot out = inverse_fisher;
}
#// Calculate the inverse Fisher Oscillator for different smoothed price series
def ifish0  = inverse_fisher(src, Length, Smooth * 1);
def ifish1  = inverse_fisher(src, Length, Smooth * 2);
def ifish2  = inverse_fisher(src, Length, Smooth * 3);
def ifish3  = inverse_fisher(src, Length, Smooth * 4);
def ifish4  = inverse_fisher(src, Length, Smooth * 5);
def ifish5  = inverse_fisher(src, Length, Smooth * 6);

#// Calculate constants for the Butterworth filter
def pi = Double.Pi;
def mid_len  = 500;
def piPrd = pi / mid_len;
def g     = Sqrt(2);
def a1    = Exp(-g * piPrd);
def b1    = 2 * a1 * Cos(g * piPrd);
def coef2 = b1;
def coef3 = -a1 * a1;
def coef1 = (1 - b1 + a1 * a1) / 4;

#// Previous source and butter filter values
def butter;
#// Handle null values using the nz function
def avg = Sum(src, Length) / Length;
def norm_price = (src - avg) / StDev(src, Length);
def smWMA = WMA(norm_price, Smooth);
def prevB1 = if butter[1] then butter[1] else ifish0;
def prevB2 = if butter[2] then butter[2] else prevB1;
def srcB1 = if ifish0[1] then ifish0[1] else ifish0;
def srcB2 = if ifish0[2] then ifish0[2] else srcB1;
#// Calculate the Butterworth filter value
switch (MidLineType) {
case "Simple" :
    butter = 0;
default :
    butter = coef1 * (ifish0 + (2 * srcB1) + srcB2) + (coef2 * prevB1) + (coef3 * prevB2);
}
#// Calculate volatility as the SMA of the absolute difference between the current and previous inverse Fisher values
def volatility = Average(AbsValue(ifish0 - srcB2), 400) * multi;
#// Calculate upper and lower volatility bands
def upper_band = (volatility + butter) * (if butter == 0 then 0 else 1);
def lower_band = (butter - volatility) * (if butter == 0 then 0 else 1);
#// Assign colors to each inverse Fisher Oscillator based on its relation to the volatility bands
def color1 = if ifish0 > upper_band then 1 else if ifish0 < lower_band then -1 else 0;
def color2 = if ifish1 > upper_band then 1 else if ifish1 < lower_band then -1 else 0;
def color3 = if ifish2 > upper_band then 1 else if ifish2 < lower_band then -1 else 0;
def color4 = if ifish3 > upper_band then 1 else if ifish3 < lower_band then -1 else 0;
def color5 = if ifish4 > upper_band then 1 else if ifish4 < lower_band then -1 else 0;
def color6 = if ifish5 > upper_band then 1 else if ifish5 < lower_band then -1 else 0;

#// Plot the inverse Fisher Oscillator lines with corresponding colors
plot f1 = ifish0;
plot f2 = ifish1;
plot f3 = ifish2;
plot f4 = ifish3;
plot f5 = ifish4;
plot f6 = ifish5;
f1.AssignValueColor(if color1>0 then GlobalColor("top1") else
                    if color1<0 then GlobalColor("btm1") else GlobalColor("mid1"));
f2.AssignValueColor(if color2>0 then GlobalColor("top2") else
                    if color2<0 then GlobalColor("btm2") else GlobalColor("mid2"));
f3.AssignValueColor(if color3>0 then GlobalColor("top3") else
                    if color3<0 then GlobalColor("btm3") else GlobalColor("mid3"));
f4.AssignValueColor(if color4>0 then GlobalColor("top4") else
                    if color4<0 then GlobalColor("btm4") else GlobalColor("mid4"));
f5.AssignValueColor(if color5>0 then GlobalColor("top5") else
                    if color5<0 then GlobalColor("btm5") else GlobalColor("mid5"));
f6.AssignValueColor(if color6>0 then GlobalColor("top6") else
                    if color6<0 then GlobalColor("btm6") else GlobalColor("mid6"));
#// Plot the Butterworth filter and volatility bands

plot mid = if last then na else butter; # Plot the Butterworth filter
plot upBand = if upper_band then upper_band else na;
plot dnBand = if lower_band then lower_band else na;
mid.SetStyle(Curve.SHORT_DASH);
mid.SetDefaultColor(GlobalColor("band"));
upBand.SetDefaultColor(GlobalColor("band"));
dnBand.SetDefaultColor(GlobalColor("band"));

#-- Cloud

AddCloud(if ifish0>upper_band then ifish0 else na, upper_band, GlobalColor("top6"));
AddCloud(if ifish0<lower_band then lower_band else na, ifish0, GlobalColor("btm6"));

#-- color Bars
def col = color1 + color2 + color3 + color4 + color5 + color6;
AssignPriceColor(if !colorBars then Color.CURRENT else
                 if col > 5 then GlobalColor("top1") else
                 if col > 4 then GlobalColor("top2") else
                 if col > 3 then GlobalColor("top3") else
                 if col > 2 then GlobalColor("top4") else
                 if col > 1 then GlobalColor("top5") else
                 if col < -5 then GlobalColor("btm1") else
                 if col < -4 then GlobalColor("btm2") else
                 if col < -3 then GlobalColor("btm3") else
                 if col < -2 then GlobalColor("btm4") else
                 if col < -1 then GlobalColor("btm5") else  GlobalColor("mid2"));
#-- LAbel

AddLabel(showLabel, "Trend Strength (" + AsPercent(col / 6) + ")",
                 if col > 5 then GlobalColor("top1") else
                 if col > 4 then GlobalColor("top2") else
                 if col > 3 then GlobalColor("top3") else
                 if col > 2 then GlobalColor("top4") else
                 if col > 1 then GlobalColor("top5") else
                 if col < -5 then GlobalColor("btm1") else
                 if col < -4 then GlobalColor("btm2") else
                 if col < -3 then GlobalColor("btm3") else
                 if col < -2 then GlobalColor("btm4") else
                 if col < -1 then GlobalColor("btm5") else  GlobalColor("mid2"));

#-- END of CODE