I need help to write for me scrip of ignited bar as follow:
checks if the absolute size of the current bar (|close - open|) is 2 time greater than the average size of the previous 50 bars. And volume of the current bar is at least 3 times the average volume of the previous 50 bars.
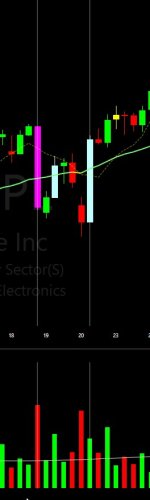
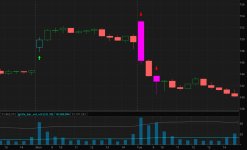
When ignited bar is bullish make bar color showing on chart in blue color see photo watch
When ignited bar is Berish make bar color showing on chart in dark fuchsia color see photo attach
Also make edit availed to change the condition separate for volume and bar
bullish when close >open
bearish when close <open
checks if the absolute size of the current bar (|close - open|) is 2 time greater than the average size of the previous 50 bars. And volume of the current bar is at least 3 times the average volume of the previous 50 bars.
When ignited bar is bullish make bar color showing on chart in blue color see photo watch
When ignited bar is Berish make bar color showing on chart in dark fuchsia color see photo attach
Also make edit availed to change the condition separate for volume and bar
bullish when close >open
bearish when close <open