R
rodhsnyc
Guest
Salutations,
Let me first say how glad I am to have found this Brotherhood, and I am grateful to now be apart of it! I hope to add value, quickly, one day soon.
----------------------------------------------
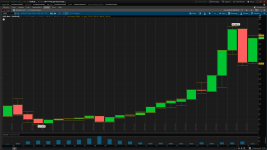
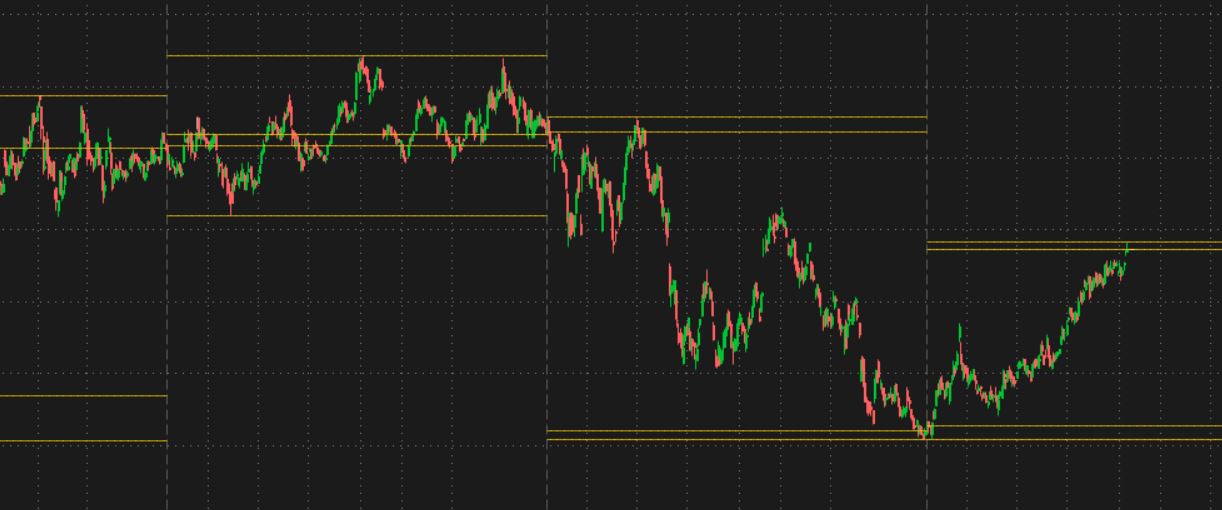
Now, my problem is that I cannot get the lines to extend fully (or as far as possible) to the left and right at the same time for the levels (high,low, open, close) that are automatically generated. Could someone please help me achieve this? I have been working for days on and off and I cannot figure this out to save my life! I have inserted the code in question below.
input aggregationPeriod = AggregationPeriod.YEAR;
input length = 1;
input displace = -0;
input showOnlyLast100Period = yes;
input barsBack = 100;
plot DailyHigh;
plot DailyLow;
plot DailyOpen;
plot DailyClose;
if showOnlyLast100Period and !IsNaN(close(period = aggregationPeriod)[-100]) {
DailyHigh = barsBack;
DailyLow = Double.NaN;
DailyOpen = Double.NaN;
DailyClose = Double.NaN;
} else {
DailyHigh = Highest(high(period = aggregationPeriod)[-displace], length);
DailyLow = Lowest(low(period = aggregationPeriod)[-displace], length);
DailyOpen = Highest(open(period = aggregationPeriod)[-displace], length);
DailyClose = Lowest(close(period = aggregationPeriod)[-displace], length);
}
DailyHigh.SetDefaultColor(GetColor(4));
DailyHigh.SetPaintingStrategy(PaintingStrategy.HORIZONTAL);
DailyLow.SetDefaultColor(GetColor(4));
DailyLow.SetPaintingStrategy(PaintingStrategy.HORIZONTAL);
DailyClose.SetDefaultColor(GetColor(4));
DailyClose.SetPaintingStrategy(PaintingStrategy.HORIZONTAL);
DailyOpen.SetDefaultColor(GetColor(4));
DailyOpen.SetPaintingStrategy(PaintingStrategy.HORIZONTAL);


