
Hi everyone,
I'm looking for help creating a ThinkScript study that meets the following conditions:
 Requirements:
I'm looking for help creating a ThinkScript study that meets the following conditions:
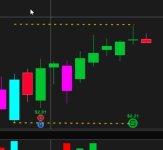
Requirements:- Plot two horizontal lines:
- One for the highest high from the 10 bars before yesterday.
- One for the lowest low from the same 10 bars.
- These lines should:
- Be perfectly horizontal (i.e., fixed value, not changing every bar).
- Display for only the most recent 10 bars on the chart.
- Update automatically every new bar (so as time moves forward, the lines shift forward too, based on the 10-bar window ending at the bar before the current one).
Attachments
Last edited by a moderator:
