Hi ThinsScript Gurus,
I am looking for a script with indicator which marks an arrow whenever current high breaks above the highest from the time interval selected. I am new in scripting so have limited ability to script.
If there is any such script existing , please point in that.
For Eg.
I had this one script which shows for day's highest , but it does not work dynamically picking up time interval and aggregation period.
# Breakout Above Current Day's High Indicator
# Define the condition to identify the current day's high
def todayHigh = if GetDay() != GetDay()[1] then high else Max(high, todayHigh[1]);
# Condition for breaking above the current day's high
def breakout = high > todayHigh[1];
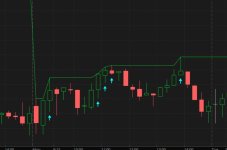
# Plot the Blue Arrow when the breakout condition is true
plot breakoutSignal = if breakout then high else Double.NaN;
breakoutSignal.SetPaintingStrategy(PaintingStrategy.ARROW_UP);
breakoutSignal.SetDefaultColor(Color.BLUE);
breakoutSignal.SetLineWeight(2);
I am looking for a script with indicator which marks an arrow whenever current high breaks above the highest from the time interval selected. I am new in scripting so have limited ability to script.
If there is any such script existing , please point in that.
For Eg.
- If time interval and Aggregation Period selected On Chart is "1 Day - 1 Min", I want an arrow on candle when current high of Candle breaks above the day's highest.
- If time interval and Aggregation Period selected On Chart is "1 Year - Daily ", I want an arrow to show up whenever current high on daily chart exceeds the highest price in the whole year. So, for eg on daily chart , if in calendar year 2024 , highest price was $15 in February .. and now in August if it goes above $15 .. the arrow should be displayed.
I had this one script which shows for day's highest , but it does not work dynamically picking up time interval and aggregation period.
# Breakout Above Current Day's High Indicator
# Define the condition to identify the current day's high
def todayHigh = if GetDay() != GetDay()[1] then high else Max(high, todayHigh[1]);
# Condition for breaking above the current day's high
def breakout = high > todayHigh[1];
# Plot the Blue Arrow when the breakout condition is true
plot breakoutSignal = if breakout then high else Double.NaN;
breakoutSignal.SetPaintingStrategy(PaintingStrategy.ARROW_UP);
breakoutSignal.SetDefaultColor(Color.BLUE);
breakoutSignal.SetLineWeight(2);