You should upgrade or use an alternative browser.
Heiken-Ashi Moving Average (HAMA) for ThinkorSwim
- Thread starter MBF
- Start date
Join useThinkScript to post your question to a community of 21,000+ developers and traders.
Feel free to edit the length of the moving average to suit your requirements:
# START
def length = 8;
def HAopen;
def HAhigh;
def HAlow;
def HAclose;
HAopen = CompoundValue(1, (haopen[1] + haclose[1]) / 2, (open[1] + close) / 2);
HAhigh = Max(high, close[1]);
HAlow = Min(low, close[1]);
HAclose = (HAopen + HAclose[1] + HAlow + close) / 4;
AssignPriceColor(if HAclose > HAopen then Color.GREEN else color.RED);
plot HAMA = Average(HAclose, length);
# END#HK
#Use bar to figure trendDown or confirm.
#heikin ashi bars. close=OHLC/4. open=1/2(open[1]+close[1]) and HA trend
#
def haclose = (open + high + low + close) / 4;
def haopen = CompoundValue(1, (haopen[1] + haclose[1]) / 2, (open[1] + close[1]) / 2);
def hahigh=max(open,max(close,high));def halow=min(open,min(close,high));
def HAtrendUP = haclose > haclose[1];
def upBar = if HAtrendUP then upBar[1] + 1 else 0;
def HATrendDown = haclose <= haclose[1];
def downBar = if HATrendDown then downBar[1] + 1 else 0;
def bars = upBar + downBar;
#the one with body small relative to wicks . let say less than 0.3
def HAtransition=absvalue((haopen-haclose)/(hahigh-halow))<0.3;
def HARed = HAOpen > HAclose;
def HAGreen = !HARed;
def HADecidedRed = HARed and HAHigh == HAopen;
def HADecidedGreen = HAGreen and HAlow == HAOpen;
plot data=0;
#
AssignPriceColor( if hatransition then color.MAGENTA
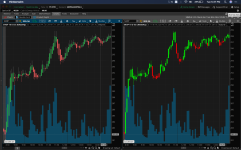
else Color.CURRENT);Take a look at this beauty.
p.s. I am now of opinion that inidcator based on the single timeframe can never do that. In fact probably no indicator can do that with high probability if its single timeframe, price action based only. There are other factors which determine that.
I been doing stocks in play for a while now - its far from easy! (at least for me)
Here is this very simple scan: https://tos.mx/WXUxaCb
Another proxy for stocks in play I use is sizzle index. (>2 is wide critera, >5 picks something with big catalyst practically every day)
There is small bug here (uses close instead of haclose). Anyhow this HA code works better than one I was using before. Integrated it with my transition code https://tos.mx/aA77lzO
def length = 8;
def HAopen;
def HAhigh;
def HAlow;
def HAclose;
HAopen = CompoundValue(1, (haopen[1] + haclose[1]) / 2, (open[1] + close) / 2);
HAhigh = Max(high, close[1]);
HAlow = Min(low, close[1]);
HAclose = (HAopen + HAclose[1] + HAlow + close) / 4;
AssignPriceColor(if HAclose > HAopen then Color.GREEN else color.RED);
plot HAMA = Average(HAclose, length);HighBredCloud
Well-known member
# Mobius
# SuperTrend HeikenAshi
# V03.10.2015
# Up = (HIGH + LOW) / 2 + Multiplier * ATR
# Down = (HIGH + LOW) / 2 – Multiplier * ATR
# When the change of trend occurs, the indicator flips

input AtrMult = .70;
input nATR = 4;
input AvgType = AverageType.HULL;
input PaintBars = yes;
input BubbleOn = no;
input ShowLabel = no;
input AlertOn = no;
input PlotLine = no;

def HAopen;
def HAhigh;
def HAlow;
def HAclose;
HAopen = CompoundValue(1, (haopen[1] + haclose[1]) / 2, (open[1] + close) / 2);
HAhigh = Max(high, close[1]);
HAlow = Min(low, close[1]);
haclose = (HAopen + HAclose[1] + HAlow + close) / 4;
def v = volume;
def bar = barNumber();
def EOD = if SecondsTillTime(1545) == 0 and
             SecondsFromTime(1545) == 0
          then 1
          else 0;
def NotActive = if SecondsFromTime(1545) > 0
                then 1
                else 0;
def ATR = MovingAverage(AvgType, TrueRange(HAhigh, HAclose, HAlow), nATR);
def UP = HL2 + (AtrMult * ATR);
def DN = HL2 + (-AtrMult * ATR);
def ST = if close < ST[1]
         then Round(UP / tickSize(), 0) * tickSize()
         else Round(DN / tickSize(), 0) * tickSize();
plot SuperTrend = ST;
SuperTrend.SetHiding(!PlotLine);
SuperTrend.AssignValueColor(if close < ST then Color.RED else Color.GREEN);
SuperTrend.SetPaintingStrategy(PaintingStrategy.Line);
AssignPriceColor(if PaintBars and close < ST
                 then Color.RED
                 else if PaintBars and close > ST
                      then Color.GREEN
                      else Color.CURRENT);
plot ST_point = if isNaN(close[-1])
                then ST
                else double.nan;
ST_point.SetStyle(Curve.Points);
ST_point.SetLineWeight(3);
ST_point.SetDefaultColor(Color.Yellow);
# End Code SuperTrend HeikenAshiHighBredCloud
Well-known member
I have seen scripts where actual Heiken Ashi candles appear and overlay the regular candles sticks...its not what I am looking for but am curious if somehow instead of just overlaying the regular candles with Heiken Ashi...the regular candles can just be painted in the Heikin Ashi trend instead. Any ideas on this would be helpful...
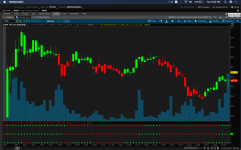
This is what I had in mind:
1. Heikin Ashi Trend on regular candlesticks by painting the bars.
2. Create an indicator as the one pictured below that allows you to run no more than 3 popular SuperTrends, such as the one you shared above, simultaneously.
@netarchitech This is what I was referring to in post #208 as something for you to keep in mind while you work on the MACD...FREMA...PPO indicator in that same format.
https://usethinkscript.com/threads/...dicator-for-thinkorswim.957/page-11#post-8867
I figured I would post here to keep it relevant and to make it easy to find for others...Save @BenTen the trouble of moving the thread.
@skynetgen There are so many SuperTrend type indicators out there just on this site alone...and I find that they still work slightly differently than others in their default settings...I actually wanted to see IF there is a way to do what I described in post #21...
In regards do time frames and SuperTrends...I am currently testing a SuperTrend code by Mobius that allowed for time aggregation...So in my case on a 5 min chart I set the SuperTrend to paint the candlesticks as if on a 15 min chart. The problem that I had was when the 15 min chart started to repaint the candle bar within the 15 min timespan 3 of the candlesticks on the 5 min time frame also repainted, naturally. This was a bit confusing to me as what was once thought of a "trend" quickly became a question of a pullback or a reversal.
I still find that original Heikin Ashi works the best as far as the trend goes...perhaps there are other SuperTrends that I have not seen yet...I know @tomsk provided a script above that I've not seen yet...I reviewed it again and changed the setting from .7 to .4 and the candles resemble Heikin Ashi more...but I wasn't able to see if that script repaints a lot or not.
I would be very curious to see how something described in post #21 would play out...but with SuperTrends focusing on different aspects...such as price...Have you seen the Price Trend Indicator?
Attachments
Regarding MTF - I already run 2-3 timeframes windows in my analysis so its usually not really necessary to have MTF on a single timeframes
I like ST - its one of better price action based indicators imho, especially as confirmation for some finer grainer entry indicators. HKA is useful in certain ways - I like to use it for trend transition and trend visualization when I don't care about precision and entries. But honestly I can achieve similar results just using multiple moving averages system.
What is the "price trend" indicator you mentioned?
HighBredCloud
Well-known member
Here is the Price Trend "SuperTrend"
Code:
# Price Trend
# Drew Griffith

#hint: Color candlesticks based on price movement. New highs are green; New lows are red; Sideways trading are grey.

declare upper;

input trail = 1;
input displace = 1;
input aggregationperiod = aggregationperiod.day;

def new_high = close > highest(high(period = aggregationperiod), trail)[displace];
def new_low = close < lowest(low(period = aggregationperiod), trail)[displace];

def greenprice = if new_high then yes else if new_low then no else new_high[1];
def redprice = if new_low then yes else if new_high then no else new_low[1];

plot bullish = greenprice;
plot neutral = !greenprice and !redprice;
plot bearish = redprice;

plot rating =
if greenprice then 1
else if redprice then .5
else 0;

def paintbars = yes;

bullish.setdefaultcolor(color.uptick);
bullish.setpaintingstrategy(paintingstrategy.boolean_points);
bullish.setlineweight(3);
bullish.hide();
neutral.setdefaultcolor(color.gray);
neutral.setpaintingstrategy(paintingstrategy.boolean_points);
neutral.setlineweight(3);
neutral.hide();
bearish.setdefaultcolor(color.downtick);
bearish.setpaintingstrategy(paintingstrategy.boolean_points);
bearish.setlineweight(3);
bearish.hide();
rating.hide();
rating.hidebubble();

defineglobalcolor("bullish", color.uptick);
defineglobalcolor("neutral", color.gray);
defineglobalcolor("bearish", color.downtick);
assignpricecolor(if !paintbars then color.current else if greenprice then globalcolor("bullish") else if redprice then globalcolor("bearish") else globalcolor("neutral"));| Thread starter | Similar threads | Forum | Replies | Date |
|---|---|---|---|---|
|
|
RSI-Heiken Ashi For ThinkOrSwim | Indicators | 27 | |
|
|
MA Colored Heiken Ashi Trend with PaintBars for ThinkorSwim | Indicators | 17 | |
| P | Heikin-Ashi Candles Lower Chart For ThinkorSwim (assorted versions) | Indicators | 27 | |
| V | Heikin Ashi For ThinkOrSwim | Indicators | 23 | |
|
|
Smoothed Heikin-Ashi for ThinkorSwim | Indicators | 40 |
Similar threads
-
-
MA Colored Heiken Ashi Trend with PaintBars for ThinkorSwim
- Started by Welkin
- Replies: 17
-
Heikin-Ashi Candles Lower Chart For ThinkorSwim (assorted versions)
- Started by petergluis
- Replies: 27
-
-
Not the exact question you're looking for?
Start a new thread and receive assistance from our community.
Similar threads
-
-
MA Colored Heiken Ashi Trend with PaintBars for ThinkorSwim
- Started by Welkin
- Replies: 17
-
Heikin-Ashi Candles Lower Chart For ThinkorSwim (assorted versions)
- Started by petergluis
- Replies: 27
-
-
Similar threads
-
-
MA Colored Heiken Ashi Trend with PaintBars for ThinkorSwim
- Started by Welkin
- Replies: 17
-
Heikin-Ashi Candles Lower Chart For ThinkorSwim (assorted versions)
- Started by petergluis
- Replies: 27
-
-
The Market Trading Game Changer
- Exclusive indicators
- Proven strategies & setups
- Private Discord community
- ‘Buy The Dip’ signal alerts
- Exclusive members-only content
- Add-ons and resources
- 1 full year of unlimited support
Frequently Asked Questions
useThinkScript is the #1 community of stock market investors using indicators and other tools to power their trading strategies. Traders of all skill levels use our forums to learn about scripting and indicators, help each other, and discover new ways to gain an edge in the markets.
We get it. Our forum can be intimidating, if not overwhelming. With thousands of topics, tens of thousands of posts, our community has created an incredibly deep knowledge base for stock traders. No one can ever exhaust every resource provided on our site.
If you are new, or just looking for guidance, here are some helpful links to get you started.
- The most viewed thread:
https://usethinkscript.com/threads/repainting-trend-reversal-for-thinkorswim.183/ - Our most popular indicator:
https://usethinkscript.com/threads/buy-the-dip-indicator-for-thinkorswim.3553/ - Answers to frequently asked questions:
https://usethinkscript.com/threads/answers-to-commonly-asked-questions.6006/


