You should upgrade or use an alternative browser.
Heaviness Indicator
- Thread starter CDG
- Start date
No. It is not a 'real' indicator. It is a name created by one trader, who has never shared his code. But yet, he raves about how great it is.Someone in a different stock group was going on about how they love the "Heaviness Indicator". Anyone familiar with that or can post sample code for it? I think it can be found in a variety of platforms, but not TOS.
It is a dip script. I am guessing that he uses bands to find his dips. Not as efficient as:
https://usethinkscript.com/threads/buy-the-dip-with-dynamic-ranges.12089/
when used w/ the tape reader:
https://usethinkscript.com/threads/how-to-read-and-trade-the-uts-tape-reader-chart-setup.12134/
Thanks for mentioning this indicator. Have you seen this indicator repainting any of the arrows? Because it seems to good to be true. The reversal are pretty on point and looking through the script there isn't really much in it. I was looking at the 3 min chart on /ES and it showed some very good arrows that pinpointed reversals. I am sure you have observed this indicator longer than I have so have you seen the arrows repainting or being painted after a set number of candles, is there a displace?@CDG Heaviness seems like another way to say trend reversal. For that, I use a TOS script called SequenceCounter. It is based on the copyrighted work of Tom DeMark (see his book The New Science of Technical Analysis for more details on this and other ideas of his) and is a simple way of stating when the trend (up or down) has gotten long in the tooth. Through observation and analysis, he recognized that the trend tends to develop over a specific set of circumstances. It does not give specific signals the way other indicators do. Instead, you should think of them as set ups. I use this tool on all time frames. Check it out and see if it fits your needs.
I have seen no ability to specify displacements, but you can change the formation period to a different value. I have set up one of my scan conditions to look for formation values above 8 for x bars, where x could be your displacement value.
I found some excellent information on how to use Tom Demark's tools on the web. Well worth seeking out. It is also worthwhile to read the TOS study documentation for SequenceCounter.
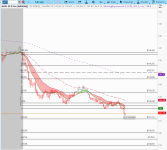
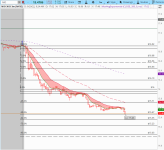
Drawing a quadrant line (with +5% and -5%) from top of the first 3min candle of the day as 100% and bottom of that candle as 75%.
Needs more backtesting.
Attachments
Join useThinkScript to post your question to a community of 21,000+ developers and traders.
| Thread starter | Similar threads | Forum | Replies | Date |
|---|---|---|---|---|
| H | Dot Indicator for ThinkorSwim | Questions | 0 | |
| P | Trouble adapting a time-relative volume indicator | Questions | 1 | |
| A | ADX increasing indicator? | Questions | 2 | |
| T | Does anyone have or can write option volume activity indicator | Questions | 0 | |
| T | change chart bubble colors from the indicator settings similar to plot color | Questions | 1 |
Similar threads
-
-
-
-
Does anyone have or can write option volume activity indicator
- Started by TraderDan0639
- Replies: 0
-
change chart bubble colors from the indicator settings similar to plot color
- Started by tosalerts6247
- Replies: 1
Not the exact question you're looking for?
Start a new thread and receive assistance from our community.
Similar threads
-
-
-
-
Does anyone have or can write option volume activity indicator
- Started by TraderDan0639
- Replies: 0
-
change chart bubble colors from the indicator settings similar to plot color
- Started by tosalerts6247
- Replies: 1
Similar threads
-
-
-
-
Does anyone have or can write option volume activity indicator
- Started by TraderDan0639
- Replies: 0
-
change chart bubble colors from the indicator settings similar to plot color
- Started by tosalerts6247
- Replies: 1
The Market Trading Game Changer
- Exclusive indicators
- Proven strategies & setups
- Private Discord community
- ‘Buy The Dip’ signal alerts
- Exclusive members-only content
- Add-ons and resources
- 1 full year of unlimited support
Frequently Asked Questions
useThinkScript is the #1 community of stock market investors using indicators and other tools to power their trading strategies. Traders of all skill levels use our forums to learn about scripting and indicators, help each other, and discover new ways to gain an edge in the markets.
We get it. Our forum can be intimidating, if not overwhelming. With thousands of topics, tens of thousands of posts, our community has created an incredibly deep knowledge base for stock traders. No one can ever exhaust every resource provided on our site.
If you are new, or just looking for guidance, here are some helpful links to get you started.
- The most viewed thread:
https://usethinkscript.com/threads/repainting-trend-reversal-for-thinkorswim.183/ - Our most popular indicator:
https://usethinkscript.com/threads/buy-the-dip-indicator-for-thinkorswim.3553/ - Answers to frequently asked questions:
https://usethinkscript.com/threads/answers-to-commonly-asked-questions.6006/


