#Golden Zone Strategy (Created using ChatGPT)
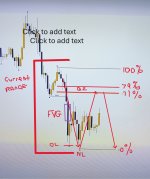
# This script highlights the candles that have detected imbalances (Fair Value Gaps),
# plots Golden Zone Fibonacci levels (71% and 79%), and includes Take Profit (at 100% Fibonacci)
# and Stop Loss (at 0% Fibonacci) levels.
# The Fibonacci levels are calculated dynamically based on the highest high and lowest low of the most recent price action.
# Define the lookback period for high/low calculation
input lookbackBars = 50;
# Calculate the highest high and lowest low over the lookback period
def highestHigh = highest(high, lookbackBars);
def lowestLow = lowest(low, lookbackBars);
# Calculate Fibonacci retracement levels (71% and 79%)
def fib0 = lowestLow;
def fib100 = highestHigh;
def fib71 = fib0 + 0.71 * (fib100 - fib0); # 71% retracement level
def fib79 = fib0 + 0.79 * (fib100 - fib0); # 79% retracement level
# Detect Imbalances (Fair Value Gap)
def imbalanceUp = high[1] < low; # Bullish imbalance (gap down)
def imbalanceDown = low[1] > high; # Bearish imbalance (gap up)
# Market Structure Breaks (Swing High / Swing Low Breaks)
# Market structure break for bullish trend: Current price must break above the previous swing high
def breakOfStructureUp = close > highestHigh[1]; # Break above previous swing high
# Market structure break for bearish trend: Current price must break below the previous swing low
def breakOfStructureDown = close < lowestLow[1]; # Break below previous swing low
# Condition 1: Break of structure (for both bullish and bearish)
def breakStructure = breakOfStructureUp or breakOfStructureDown;
# Condition 2: Imbalance (gap up or gap down)
def gapUp = low[1] > high; # Bearish imbalance (gap up)
def gapDown = high[1] < low; # Bullish imbalance (gap down)
# Condition 3: Retracement to Golden Zone (between 71% and 79% Fibonacci)
def withinGoldenZone = close >= fib71 and close <= fib79;
# Combine all conditions
def buySignalCondition = breakOfStructureUp and gapDown and withinGoldenZone; # Buy signal
def sellSignalCondition = breakOfStructureDown and gapUp and withinGoldenZone; # Sell signal
# Plot Fibonacci retracement levels as horizontal lines (always visible)
plot fib71Line = fib71;
plot fib79Line = fib79;
# Set appearance of the Fibonacci levels
fib71Line.SetDefaultColor(Color.CYAN);
fib79Line.SetDefaultColor(Color.GREEN);
# Highlight the Golden Zone area (between 71% and 79% retracement)
AddCloud(fib71Line, fib79Line, Color.YELLOW, Color.YELLOW);
# Highlight Take Profit (100% Fibonacci) and Stop Loss (0% Fibonacci) levels
plot takeProfitLine = fib100; # Take Profit at 100% Fibonacci (Swing High)
plot stopLossLine = fib0; # Stop Loss at 0% Fibonacci (Swing Low)
# Set the appearance of Take Profit and Stop Loss lines
takeProfitLine.SetDefaultColor(Color.BLUE);
stopLossLine.SetDefaultColor(Color.RED);
# Set line weight for better visibility
fib71Line.SetLineWeight(2);
fib79Line.SetLineWeight(2);
takeProfitLine.SetLineWeight(2);
stopLossLine.SetLineWeight(2);
# Optional: Plot the swing high and low for reference
plot swingHighLine = highestHigh;
plot swingLowLine = lowestLow;
swingHighLine.SetDefaultColor(Color.RED);
swingLowLine.SetDefaultColor(Color.RED);
# Set line weight for better visibility
swingHighLine.SetLineWeight(1);
swingLowLine.SetLineWeight(1);
# Highlight candles with imbalances (gap up or gap down)
# Bullish imbalance (gap down) — green candle
AssignPriceColor(if buySignalCondition then Color.GREEN else Color.CURRENT);
# Bearish imbalance (gap up) — red candle
AssignPriceColor(if sellSignalCondition then Color.RED else Color.CURRENT);
# Add Buy and Sell signals as arrows or labels
plot buySignalArrow = if buySignalCondition then low - 0.1 else Double.NaN;
plot sellSignalArrow = if sellSignalCondition then high + 0.1 else Double.NaN;
buySignalArrow.SetPaintingStrategy(PaintingStrategy.ARROW_UP);
buySignalArrow.SetDefaultColor(Color.GREEN);
buySignalArrow.SetLineWeight(3);
sellSignalArrow.SetPaintingStrategy(PaintingStrategy.ARROW_DOWN);
sellSignalArrow.SetDefaultColor(Color.RED);
sellSignalArrow.SetLineWeight(3);