
ATR-Based Range Filter Trend System with Multi-Layer Confirmation
Author states:
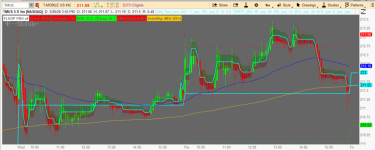
FLOOP is an ATR-adaptive range filter indicator built from the ground up and
optimized using a machine learning ensemble of Random Forest, XGBoost, and
LightGBM models trained across 8,000 bars and 3 distinct market regimes
(trending, choppy, and volatile). Every scoring weight, confluence factor, and
signal filter in this indicator was derived from ML feature importance analysis
— not guesswork.
# FLOOP Pro - ThinkScript Version
# © TheRealDrip2Rip - Adapted from Pine Script to ThinkScript
# Range Filter with EMA Alignment & Anti-Chop Filters
It combines:

Author states:
FLOOP is an ATR-adaptive range filter indicator built from the ground up and
optimized using a machine learning ensemble of Random Forest, XGBoost, and
LightGBM models trained across 8,000 bars and 3 distinct market regimes
(trending, choppy, and volatile). Every scoring weight, confluence factor, and
signal filter in this indicator was derived from ML feature importance analysis
— not guesswork.
# FLOOP Pro - ThinkScript Version
# © TheRealDrip2Rip - Adapted from Pine Script to ThinkScript
# Range Filter with EMA Alignment & Anti-Chop Filters
It combines:
- Range Filter (trend engine)
- EMA alignment (trend confirmation)
- Momentum (ROC)
- Anti-chop filters (ADX + Choppiness + cooldown)
- Signal scoring
- Pivot levels
Code:
declare upper;

# ▌ INPUTS ─────────────────────────────────────────────────────────────────

# Pivot Levels
input showPivots = yes;
input pivotTimeFrame = AggregationPeriod.DAY;
input pivotFormula = 1; # 1=Classic, 2=Fibonacci, 3=Camarilla
input showPivotLabels = yes;
input extendLinesLeft = 100;
input colorBrokenLevels = yes;

# Core Settings
input sensitivity = 6;
input atrLength = 14;
input atrMultiplier = 0.8;

# Higher Timeframe
input htfTimeFrame = AggregationPeriod.THIRTY_MIN;
input htfMALength = 90;

# EMA Settings
input showEMA = yes;
input emaFastPeriod = 60;
input emaSlowPeriod = 200;

# Anti-Chop Filters
input useADX = yes;
input adxLength = 14;
input adxThreshold = 20.0;
input useChoppiness = yes;
input choppinessLength = 14;
input choppinessMax = 61.8;
input useCooldown = yes;
input cooldownBars = 5;

# Display Settings
input showLabels = yes;
input showArrows = yes;
input showFilterLine = yes;
input showTrailingBand = yes;
input showBackgroundTint = no;
input emaFilterRequired = yes;
input chartTheme = 1; # 1=Dark, 2=Light

# ▌ CORE RANGE FILTER ─────────────────────────────────────────────────────
def atr = ATR(atrLength);
def rangeValue = atr * atrMultiplier * (sensitivity / 8.0);

def filt;
def trend;
def sig;

if BarNumber() == 1 {
filt = close;
trend = 0;
sig = 0;
} else {
if close > filt[1] + rangeValue {
filt = close - rangeValue;
trend = 1;
} else if close < filt[1] - rangeValue {
filt = close + rangeValue;
trend = -1;
} else {
filt = filt[1];
trend = trend[1];
}
sig = if trend != trend[1] then trend else 0;
}

plot RangeFilterPlot = if showFilterLine then filt else Double.NaN;
RangeFilterPlot.SetDefaultColor(Color.CYAN);
RangeFilterPlot.SetLineWeight(2);

# ▌ ATR & VOLATILITY ────────────────���─────────────────────────────────────
def atrNorm = atr / close * 100;

def atrRank = (
(if atr >= atr[0] then 1 else 0) +
(if atr >= atr[1] then 1 else 0) +
(if atr >= atr[2] then 1 else 0) +
(if atr >= atr[3] then 1 else 0) +
(if atr >= atr[4] then 1 else 0) +
(if atr >= atr[5] then 1 else 0) +
(if atr >= atr[10] then 1 else 0) +
(if atr >= atr[20] then 1 else 0) +
(if atr >= atr[30] then 1 else 0) +
(if atr >= atr[60] then 1 else 0)
) / 10 * 100;

def scoreVol = (if atrRank < 80 then 1 else 0);

# ▌ MOMENTUM ──────────────────────────────────────────────────────────────
def roc5 = (close - close[5]) / close[5] * 100;
def roc10 = (close - close[10]) / close[10] * 100;
def roc20 = (close - close[20]) / close[20] * 100;

def momBull = roc5 > 0 and roc10 > 0 and roc20 > 0;
def momBear = roc5 < 0 and roc10 < 0 and roc20 < 0;
def momAligned = (trend == 1 and momBull) or (trend == -1 and momBear);
def momPartial = (trend == 1 and roc5 > 0) or (trend == -1 and roc5 < 0);

# ▌ ADX CALCULATION ───────────────────────────────────────────────────────
def ADXValue = ADX(adxLength);
def adxTrending = ADXValue >= adxThreshold;

# ▌ CHOPPINESS INDEX ──────────────────────────────────────────────────────
def chopAtrSum = Sum(atr, choppinessLength);
def chopHi = Highest(high, choppinessLength);
def chopLo = Lowest(low, choppinessLength);
def chopRange = chopHi - chopLo;
def chopIndex = if chopRange > 0 then 100 * Log(chopAtrSum / chopRange) / Log(choppinessLength) else 50;
def chopClear = chopIndex <= choppinessMax;

# ▌ ANTI-CHOP: Signal Cooldown ────────────────────────────────────────────
def barsSinceSignal = if sig != 0 then 0 else barsSinceSignal[1] + 1;
def cooldownClear = !useCooldown or barsSinceSignal >= cooldownBars;

# ▌ ANTI-CHOP: Combined Gate ──────────────────────────────────────────────
def chopGate = (!useADX or adxTrending) and (!useChoppiness or chopClear) and cooldownClear;
def chopPenalty = (if useADX and !adxTrending then -1 else 0) + (if useChoppiness and !chopClear then -1 else 0);

# ▌ EMA OVERLAY + ALIGNMENT ───────────────────────────────────────────────
def emaFastVal = ExpAverage(close, emaFastPeriod);
def emaSlowVal = ExpAverage(close, emaSlowPeriod);

def emaCrossBull = emaFastVal > emaSlowVal;
def emaPriceAbove = close > emaFastVal;
def emaSlopeUp = emaFastVal > emaFastVal[5];
def emaAllBull = emaCrossBull and emaPriceAbove and emaSlopeUp;

def emaCrossBear = emaFastVal < emaSlowVal;
def emaPriceBelow = close < emaFastVal;
def emaSlopeDown = emaFastVal < emaFastVal[5];
def emaAllBear = emaCrossBear and emaPriceBelow and emaSlopeDown;

def emaCond1 = if trend == 1 then emaCrossBull else emaCrossBear;
def emaCond2 = if trend == 1 then emaPriceAbove else emaPriceBelow;

def scoreEMA = (if emaCond1 then 1 else 0) +
(if emaCond2 then 1 else 0) +
(if momAligned then 1 else 0) +
(if momPartial then 1 else 0);

def emaFullyAligned = if trend == 1 then emaAllBull else emaAllBear;

# Plot EMAs
plot EMAFastPlot = if showEMA then emaFastVal else Double.NaN;
EMAFastPlot.SetDefaultColor(Color.BLUE);
EMAFastPlot.SetLineWeight(1);

plot EMASlowPlot = if showEMA then emaSlowVal else Double.NaN;
EMASlowPlot.SetDefaultColor(Color.ORANGE);
EMASlowPlot.SetLineWeight(1);

# ▌ SIGNAL GENERATION ─────────────────────────────────────────────────────
def longSigRaw = sig == 1;
def shortSigRaw = sig == -1;
def emaGate = if emaFilterRequired then emaFullyAligned else yes;

def longSig = longSigRaw and emaGate and chopGate;
def shortSig = shortSigRaw and emaGate and chopGate;

# ▌ SIGNAL STRENGTH (0–14) ────────────────────────────────────────────────
def scoreHTF = if (trend == 1) or (trend == -1) then 1 else 0;
def scoreMTF = (if trend == 1 then 1 else 0) + (if trend == -1 then 1 else 0);
def scoreSens = (if trend != 0 then 1 else 0);

def signalStrengthRaw = scoreHTF + scoreMTF + scoreSens + scoreEMA + scoreVol;
def signalStrength = Max(0, Min(signalStrengthRaw + chopPenalty, 14));

# ▌ SIGNAL VISUALS ────────────────────────────────────────────────────────
# Long signals
plot LongArrow = if showArrows and longSig then low - atr * 0.5 else Double.NaN;
LongArrow.SetDefaultColor(Color.GREEN);
LongArrow.SetPaintingStrategy(PaintingStrategy.BOOLEAN_ARROW_UP);

# Short signals
plot ShortArrow = if showArrows and shortSig then high + atr * 0.5 else Double.NaN;
ShortArrow.SetDefaultColor(Color.RED);
ShortArrow.SetPaintingStrategy(PaintingStrategy.BOOLEAN_ARROW_DOWN);

# Labels for signals
AddChartBubble(showLabels and longSig, low - atr, "LONG", Color.GREEN, no);
AddChartBubble(showLabels and shortSig, high + atr, "SHORT", Color.RED, yes);

# Background tint
AssignBackgroundColor(if showBackgroundTint and trend == 1 then Color.DARK_GREEN else if showBackgroundTint and trend == -1 then Color.DARK_RED else Color.CURRENT);

# Bar coloring
AssignPriceColor(if trend == 1 then Color.GREEN else if trend == -1 then Color.RED else Color.GRAY);

# ▌ PIVOT POINTS ──────────────────────────────────────────────────────────
def pivotH = high(period = pivotTimeFrame)[1];
def pivotL = low(period = pivotTimeFrame)[1];
def pivotC = close(period = pivotTimeFrame)[1];

def pivotPP = (pivotH + pivotL + pivotC) / 3.0;
def pivotRange = pivotH - pivotL;

# Classic Pivot Formula
def classicR1 = 2.0 * pivotPP - pivotL;
def classicR2 = pivotPP + pivotRange;
def classicR3 = pivotH + 2.0 * (pivotPP - pivotL);
def classicR4 = pivotPP + pivotRange * 3.0;

def classicS1 = 2.0 * pivotPP - pivotH;
def classicS2 = pivotPP - pivotRange;
def classicS3 = pivotL - 2.0 * (pivotH - pivotPP);
def classicS4 = pivotPP - pivotRange * 3.0;

# Fibonacci Pivot Formula
def fibR1 = pivotPP + pivotRange * 0.382;
def fibR2 = pivotPP + pivotRange * 0.618;
def fibR3 = pivotPP + pivotRange * 1.000;
def fibR4 = pivotPP + pivotRange * 1.618;

def fibS1 = pivotPP - pivotRange * 0.382;
def fibS2 = pivotPP - pivotRange * 0.618;
def fibS3 = pivotPP - pivotRange * 1.000;
def fibS4 = pivotPP - pivotRange * 1.618;

# Camarilla Pivot Formula
def camR1 = pivotC + pivotRange * 1.1 / 12.0;
def camR2 = pivotC + pivotRange * 1.1 / 6.0;
def camR3 = pivotC + pivotRange * 1.1 / 4.0;
def camR4 = pivotC + pivotRange * 1.1 / 2.0;

def camS1 = pivotC - pivotRange * 1.1 / 12.0;
def camS2 = pivotC - pivotRange * 1.1 / 6.0;
def camS3 = pivotC - pivotRange * 1.1 / 4.0;
def camS4 = pivotC - pivotRange * 1.1 / 2.0;

# Select formula (1=Classic, 2=Fibonacci, 3=Camarilla)
def pvtR1 = if pivotFormula == 2 then fibR1 else if pivotFormula == 3 then camR1 else classicR1;
def pvtR2 = if pivotFormula == 2 then fibR2 else if pivotFormula == 3 then camR2 else classicR2;
def pvtR3 = if pivotFormula == 2 then fibR3 else if pivotFormula == 3 then camR3 else classicR3;
def pvtR4 = if pivotFormula == 2 then fibR4 else if pivotFormula == 3 then camR4 else classicR4;

def pvtS1 = if pivotFormula == 2 then fibS1 else if pivotFormula == 3 then camS1 else classicS1;
def pvtS2 = if pivotFormula == 2 then fibS2 else if pivotFormula == 3 then camS2 else classicS2;
def pvtS3 = if pivotFormula == 2 then fibS3 else if pivotFormula == 3 then camS3 else classicS3;
def pvtS4 = if pivotFormula == 2 then fibS4 else if pivotFormula == 3 then camS4 else classicS4;

# Plot Pivot Lines
plot PPLine = if showPivots then pivotPP else Double.NaN;
PPLine.SetDefaultColor(Color.CYAN);
PPLine.SetLineWeight(2);

plot R1Line = if showPivots then pvtR1 else Double.NaN;
R1Line.SetDefaultColor(Color.RED);
R1Line.SetLineWeight(1);
R1Line.SetStyle(Curve.SHORT_DASH);

plot R2Line = if showPivots then pvtR2 else Double.NaN;
R2Line.SetDefaultColor(Color.RED);
R2Line.SetLineWeight(1);
R2Line.SetStyle(Curve.SHORT_DASH);

plot R3Line = if showPivots then pvtR3 else Double.NaN;
R3Line.SetDefaultColor(Color.RED);
R3Line.SetLineWeight(1);
R3Line.SetStyle(Curve.POINTS);

plot R4Line = if showPivots then pvtR4 else Double.NaN;
R4Line.SetDefaultColor(Color.DARK_RED);
R4Line.SetLineWeight(1);
R4Line.SetStyle(Curve.POINTS);

plot S1Line = if showPivots then pvtS1 else Double.NaN;
S1Line.SetDefaultColor(Color.GREEN);
S1Line.SetLineWeight(1);
S1Line.SetStyle(Curve.SHORT_DASH);

plot S2Line = if showPivots then pvtS2 else Double.NaN;
S2Line.SetDefaultColor(Color.GREEN);
S2Line.SetLineWeight(1);
S2Line.SetStyle(Curve.SHORT_DASH);

plot S3Line = if showPivots then pvtS3 else Double.NaN;
S3Line.SetDefaultColor(Color.GREEN);
S3Line.SetLineWeight(1);
S3Line.SetStyle(Curve.POINTS);

plot S4Line = if showPivots then pvtS4 else Double.NaN;
S4Line.SetDefaultColor(Color.DARK_GREEN);
S4Line.SetLineWeight(1);
S4Line.SetStyle(Curve.POINTS);

# ▌ DEBUG INFO (Bottom Right Labels) ───────────────────────────────────────
AddLabel(yes, "FLOOP PRO v4", Color.WHITE);
AddLabel(yes, "Trend: " + (if trend == 1 then "BULL" else if trend == -1 then "BEAR" else "NEUTRAL"), if trend == 1 then Color.GREEN else if trend == -1 then Color.RED else Color.GRAY);
AddLabel(yes, "Strength: " + signalStrength + "/14", if signalStrength >= 11 then Color.GREEN else if signalStrength >= 8 then Color.ORANGE else Color.RED);
AddLabel(yes, "ADX: " + Round(ADXValue, 1) + (if adxTrending then " ✓" else " ✗"), if adxTrending then Color.GREEN else Color.RED);
AddLabel(yes, "Chop: " + Round(chopIndex, 1) + (if chopClear then " ✓" else " ✗"), if chopClear then Color.GREEN else Color.RED);
AddLabel(yes, "EMA Aligned: " + (if emaFullyAligned then "YES" else "NO"), if emaFullyAligned then Color.GREEN else Color.RED);
AddLabel(yes, "Volatility: " + (if atrRank > 75 then "HIGH" else if atrRank > 45 then "MED" else "LOW") + " (" + Round(atrRank, 0) + "%)", if atrRank > 75 then Color.RED else if atrRank > 45 then Color.ORANGE else Color.GREEN);

# ▌ TRAILING BAND (Cloud) ──────────────────────────────────────────────────
def bandWidth = atr * atrMultiplier;
def bandUpValue = filt + bandWidth * 0.5;
def bandDnValue = filt - bandWidth * 0.5;

plot BandUpPlot = bandUpValue;
BandUpPlot.SetDefaultColor(Color.GRAY);
BandUpPlot.SetLineWeight(1);
BandUpPlot.Hide();

plot BandDnPlot = bandDnValue;
BandDnPlot.SetDefaultColor(Color.GRAY);
BandDnPlot.SetLineWeight(1);
BandDnPlot.Hide();

plot RangeFilterForCloud = filt;
RangeFilterForCloud.Hide();

# Add clouds based on trend
AddCloud(BandUpPlot, RangeFilterForCloud, Color.DARK_GREEN, Color.DARK_GREEN);
AddCloud(RangeFilterForCloud, BandDnPlot, Color.DARK_RED, Color.DARK_RED);
Attachments
Last edited by a moderator: