You should upgrade or use an alternative browser.
Find High / Low + Range For Last x Number of Bars
- Thread starter thinky
- Start date
# Paris: Here's a simple prior day high/low

plot PrevHigh = high("period" = AggregationPeriod.DAY)[1];
PrevHigh.SetDefaultColor(Color.CYAN);
PrevHigh.SetPaintingStrategy(PaintingStrategy.HORIZONTAL);

plot PrevLow = low("period" = AggregationPeriod.DAY)[1];
PrevLow.SetDefaultColor(Color.YELLOW);
PrevLow.SetPaintingStrategy(PaintingStrategy.HORIZONTAL);
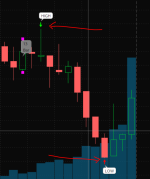
If you just want to look for the highest and lowest within the last 5 days (for example), then just turn on the "Show high/low bubbles" in ThinkorSwim's settings. Change the timeframe to the corresponding X days you want to check.
I like the way Discord bots can show a table with data like S&R, float, etc.
Time Frame: D and up
Label Range: <high - low>
Label Hi: <high>
Label Low: <low>
The good thing about it is that you can see general price movement independent of chart time frame. Need to figure out the offset.
https://usethinkscript.com/threads/high-low-lookback.331/
Will take a closer look at your code and see what I can learn from it.
Don't want to paint the entire bar per se because there are other indicators doing that, and prefer a dot/arrow to a bubble.
All of the thinkscript examples I've seen use a function call that loops through all the bars when there's a change (unless you use once per bar, or even only on daily/intraday charts) and with conditional statements (If-then-else) do something else besides getting the return value of the function.
You can use a function like this, "high[1]" but I don't need a value, I need to operate/plot on that bar alone and don't need the value of a function.
Want to visually put a mark on the first and last bars of the range/group of bars used to obtain the Hi&Low, but thinkscript seems oriented towards loop statements, seems like you can't simply "plot bar[3].arrow" (or somehting like that).
In other words, I don't need to calculate Hi&Low, I want to draw a mark on Bar[x] and Bar[y].
It only marks the user selected period with its hi/lo values, and shows the price movement range for the same period.
@horserider Wanted to visualize price ranges in a convenient way and make it generic enough to be of use in any future projects, while at the same time learning thinkscript, if only to modify other studies (eg., create settings for parameters instead of editing their code).
Join useThinkScript to post your question to a community of 21,000+ developers and traders.
Similar threads
-
Current High , Current Low on the Daily how to make a scan to find certain percentage retracement?
- Started by adarty73
- Replies: 1
-
-
-
-
Not the exact question you're looking for?
Start a new thread and receive assistance from our community.
Similar threads
-
Current High , Current Low on the Daily how to make a scan to find certain percentage retracement?
- Started by adarty73
- Replies: 1
-
-
-
-
Similar threads
-
Current High , Current Low on the Daily how to make a scan to find certain percentage retracement?
- Started by adarty73
- Replies: 1
-
-
-
-
The Market Trading Game Changer
- Exclusive indicators
- Proven strategies & setups
- Private Discord community
- ‘Buy The Dip’ signal alerts
- Exclusive members-only content
- Add-ons and resources
- 1 full year of unlimited support
Frequently Asked Questions
useThinkScript is the #1 community of stock market investors using indicators and other tools to power their trading strategies. Traders of all skill levels use our forums to learn about scripting and indicators, help each other, and discover new ways to gain an edge in the markets.
We get it. Our forum can be intimidating, if not overwhelming. With thousands of topics, tens of thousands of posts, our community has created an incredibly deep knowledge base for stock traders. No one can ever exhaust every resource provided on our site.
If you are new, or just looking for guidance, here are some helpful links to get you started.
- The most viewed thread:
https://usethinkscript.com/threads/repainting-trend-reversal-for-thinkorswim.183/ - Our most popular indicator:
https://usethinkscript.com/threads/buy-the-dip-indicator-for-thinkorswim.3553/ - Answers to frequently asked questions:
https://usethinkscript.com/threads/answers-to-commonly-asked-questions.6006/

