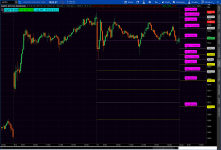
Another Fib pivots study with mid pivot point and option to choose time period for pivots. Has the option of displaying labels. If use labels might want to have an expansion area of 25 or so. Can choose to display today only or also previous periods. Lots of these so choose the one you like best.

Code:
##### Made By Leonard
##### Version 6
##### 12/07/2014
##### Copyright Leonard Tulko 2014 - 2015 All rights reserved
##### This software is licensed for individual use only.


input marketThreshold = 0.00;
input timeFrame = AggregationPeriod.DAY;
input MidPlot = yes;
input showOnlyToday = no;
input showBubble = yes;
input ShiftBubble = 5;
def n1 = ShiftBubble + 1;


def PP2 = high(period = timeFrame)[2] + low(period = timeFrame)[2] + close(period = timeFrame)[2];

plot R4;
plot R3;
plot Mid3;
plot R2;
plot Mid2;
plot R1;
plot Mid1;
plot PP;
plot Mid_1;
plot S1;
plot Mid_2;
plot S2;
plot Mid_3;
plot S3;
plot S4;

if showOnlyToday and !IsNaN(close(period = timeFrame)[-1])
then {
    R1 = Double.NaN;
    R2 = Double.NaN;
    R3 = Double.NaN;
    R4 = Double.NaN;
    PP = Double.NaN;
    S1 = Double.NaN;
    S2 = Double.NaN;
    S3 = Double.NaN;
    S4 = Double.NaN;
    Mid1 = Double.NaN;
    Mid2 = Double.NaN;
    Mid3 = Double.NaN;
    Mid_1 = Double.NaN;
    Mid_2 = Double.NaN;
    Mid_3 = Double.NaN;

} else {

    PP = (high(period = timeFrame)[1] + low(period = timeFrame)[1] + close(period = timeFrame)[1]) / 3;

    Mid1 = PP + ((high(period = timeFrame)[1] - low(period = timeFrame)[1]) * .236);
    Mid2 = PP + ((high(period = timeFrame)[1] - low(period = timeFrame)[1]) * .50);
    Mid3 = PP + ((high(period = timeFrame)[1] - low(period = timeFrame)[1]) * .786);

    Mid_1 = PP - ((high(period = timeFrame)[1] - low(period = timeFrame)[1]) * .236);
    Mid_2 = PP - ((high(period = timeFrame)[1] - low(period = timeFrame)[1]) * .50);
    Mid_3 = PP - ((high(period = timeFrame)[1] - low(period = timeFrame)[1]) * .786);

    R1 = PP + ((high(period = timeFrame)[1] - low(period = timeFrame)[1]) * .382);
    R2 = PP + ((high(period = timeFrame)[1] - low(period = timeFrame)[1]) * .618);
    R3 = PP + ((high(period = timeFrame)[1] - low(period = timeFrame)[1]) * 1.0);
    R4 = PP + ((high(period = timeFrame)[1] - low(period = timeFrame)[1]) * 1.618);

    S1 = PP - ((high(period = timeFrame)[1] - low(period = timeFrame)[1]) * .382);
    S2 = PP - ((high(period = timeFrame)[1] - low(period = timeFrame)[1]) * .618);
    S3 = PP - ((high(period = timeFrame)[1] - low(period = timeFrame)[1]) * 1.0);
    S4 = PP - ((high(period = timeFrame)[1] - low(period = timeFrame)[1]) * 1.618);


}

PP.SetDefaultColor(GetColor(0));
R1.SetDefaultColor(Color.Red);
R2.SetDefaultColor(Color.Red);
R3.SetDefaultColor(Color.Red);
R4.SetDefaultColor(Color.Red);
S1.SetDefaultColor(Color.Yellow);
S2.SetDefaultColor(Color.Yellow);
S3.SetDefaultColor(Color.Yellow);
S4.SetDefaultColor(Color.Yellow);
Mid1.SetDefaultColor(GetColor(3));
Mid2.SetDefaultColor(GetColor(3));
Mid3.SetDefaultColor(GetColor(3));
Mid_1.SetDefaultColor(GetColor(3));
Mid_2.SetDefaultColor(GetColor(3));
Mid_3.SetDefaultColor(GetColor(3));

PP.SetStyle(Curve.SHORT_DASH);
R1.SetStyle(Curve.SHORT_DASH);
R2.SetStyle(Curve.SHORT_DASH);
R3.SetStyle(Curve.SHORT_DASH);
R4.SetStyle(Curve.SHORT_DASH);
S1.SetStyle(Curve.SHORT_DASH);
S2.SetStyle(Curve.SHORT_DASH);
S3.SetStyle(Curve.SHORT_DASH);
S4.SetStyle(Curve.SHORT_DASH);
Mid1.SetStyle(Curve.SHORT_DASH);
Mid2.SetStyle(Curve.SHORT_DASH);
Mid3.SetStyle(Curve.SHORT_DASH);
Mid_1.SetStyle(Curve.SHORT_DASH);
Mid_2.SetStyle(Curve.SHORT_DASH);
Mid_3.SetStyle(Curve.SHORT_DASH);

def paintingStrategy = if timeFrame == AggregationPeriod.WEEK then PaintingStrategy.DASHES else if timeFrame == AggregationPeriod.MONTH then PaintingStrategy.DASHES else PaintingStrategy.LINE_VS_POINTS;

PP.SetPaintingStrategy(PaintingStrategy.DASHES);
R1.SetPaintingStrategy(PaintingStrategy.DASHES);
R2.SetPaintingStrategy(PaintingStrategy.DASHES);
R3.SetPaintingStrategy(PaintingStrategy.DASHES);
R4.SetPaintingStrategy(PaintingStrategy.DASHES);
S1.SetPaintingStrategy(PaintingStrategy.DASHES);
S2.SetPaintingStrategy(PaintingStrategy.DASHES);
S3.SetPaintingStrategy(PaintingStrategy.DASHES);
S4.SetPaintingStrategy(PaintingStrategy.DASHES);
Mid1.SetPaintingStrategy(PaintingStrategy.DASHES);
Mid2.SetPaintingStrategy(PaintingStrategy.DASHES);
Mid3.SetPaintingStrategy(PaintingStrategy.DASHES);
Mid_1.SetPaintingStrategy(PaintingStrategy.DASHES);
Mid_2.SetPaintingStrategy(PaintingStrategy.DASHES);
Mid_3.SetPaintingStrategy(PaintingStrategy.DASHES);

def cond = showBubble and isNaN(close[ShiftBubble]) and !isNaN(close[n1]) ;
AddChartBubble(cond,PP,Concat("PP: ",Round(PP)),color.magenta);
AddChartBubble(cond,R1,Concat("R1: ",Round(R1)),color.magenta);
AddChartBubble(cond,R2,Concat("R2: ",Round(R2)),color.magenta);
AddChartBubble(cond,R3,Concat("R3: ",Round(R3)),color.magenta);
AddChartBubble(cond,R4,Concat("R4: ",Round(R4)),color.magenta);
AddChartBubble(cond,S1,Concat("S1: ",Round(S1)),color.magenta);
AddChartBubble(cond,S2,Concat("S2: ",Round(S2)),color.magenta);
AddChartBubble(cond,S3,Concat("S3: ",Round(S3)),color.magenta);
AddChartBubble(cond,S4,Concat("S4: ",Round(S4)),color.magenta);
AddChartBubble(cond,Mid1,Concat("Mid1: ",Round(Mid1)),color.magenta);
AddChartBubble(cond,Mid2,Concat("Mid2: ",Round(Mid2)),color.magenta);
AddChartBubble(cond,Mid3,Concat("Mid3: ",Round(Mid3)),color.magenta);
AddChartBubble(cond,Mid_1,Concat("Mid_1: ",Round(Mid_1)),color.magenta);
AddChartBubble(cond,Mid_2,Concat("Mid_2: ",Round(Mid_2)),color.magenta);
AddChartBubble(cond,Mid_3,Concat("Mid_3: ",Round(Mid_3)),color.magenta);

Mid1.SetHiding (!MidPlot);
Mid2.SetHiding (!MidPlot);
Mid3.SetHiding (!MidPlot);
Mid_1.SetHiding (!MidPlot);
Mid_2.SetHiding (!MidPlot);
Mid_3.SetHiding (!MidPlot);