#fib_peaks_latest
#https://usethinkscript.com/threads/fib-retracement-based-on-the-high-low-from-market-open-close.19588/
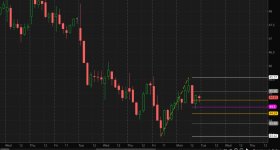
#fib retracement based on the high / low from market open / close
#https://usethinkscript.com/threads/zigzag-high-low-with-supply-demand-zones-for-thinkorswim.172/#post-7048
#post10
#robert
def na = double.nan;
def bn = BarNumber();
#def lastBar = HighestAll(if IsNaN(close) then 0 else bn);
def lastbn = HighestAll(if IsNaN(close) then 0 else bn);
def lastbar = bn == lastbn;
#def lastbar = (!isnan(close) and isnan(close[-1]));
def highx = high;
def lowx = low;
input length = 7;
def offset = Min(length - 1, lastbn - bn);
def peak = highx > Highest(highx[1], length - 1) and highx == GetValue(Highest(highx, length), -offset);
def valley = lowx < Lowest(lowx[1], length - 1) and lowx == GetValue(Lowest(lowx, length), -offset);
input arrows = no;
plot zhi = if arrows and peak then high*1.001 else na;
plot zlo = if arrows and valley then low*0.999 else na;
zlo.SetPaintingStrategy(PaintingStrategy.ARROW_UP);
zlo.SetDefaultColor(Color.red);
zlo.setlineweight(1);
zlo.hidebubble();
zhi.SetPaintingStrategy(PaintingStrategy.ARROW_DOWN);
zhi.SetDefaultColor(Color.green);
zhi.setlineweight(1);
zhi.hidebubble();
# identify the very last peak point
def lastpeakbn = HighestAll(if peak then bn else 0);
def lastpeakvalue = if bn == lastpeakbn then high else lastpeakvalue[1];
#plot hi1 = if bn < lastpeakbn then Double.NaN else lastpeakvalue;
#hi1.SetDefaultColor(Color.green);
# identify the very last valley point
def lastvalleybn = HighestAll(if valley then bn else 0);
def lastvalleyvalue = if bn == lastvalleybn then low else lastvalleyvalue[1];
#plot low1 = if bn < lastvalleybn then Double.NaN else lastvalleyvalue;
#low1.SetDefaultColor(Color.RED);
def diag1 = if bn == 1 then na
else if bn == lastpeakbn then high
else if bn == lastvalleybn then low
else na;
plot zdiag1 = diag1;
zdiag1.EnableApproximation();
zdiag1.SetDefaultColor(Color.yellow);
#zdiag1.setlineweight(1);
zdiag1.hidebubble();
zdiag1.SetStyle(Curve.MEDIUM_DASH);
def dir = if lastpeakbn > lastvalleybn then -1
else if lastpeakbn < lastvalleybn then 1
else 0;
def lastpvbn = max(lastpeakbn, lastvalleybn);
plot hi = if bn > lastpvbn then lastpeakvalue else na;
plot lo = if bn > lastpvbn then lastvalleyvalue else na;
hi.SetDefaultColor(Color.white);
lo.SetDefaultColor(Color.white);
def c0 = 0.000;
def c1 = 0.236;
def c2 = 0.382;
def c3 = 0.500;
def c4 = 0.618;
def c5 = 0.786;
def c6 = 1.000;
def rng = hi-lo;
def f1;
def f2;
def f3;
def f4;
def f5;
if dir > 0 then {
f1 = lo + (rng * c1);
f2 = lo + (rng * c2);
f3 = lo + (rng * c3);
f4 = lo + (rng * c4);
f5 = lo + (rng * c5);
} else {
f1 = hi - (rng * c1);
f2 = hi - (rng * c2);
f3 = hi - (rng * c3);
f4 = hi - (rng * c4);
f5 = hi - (rng * c5);
}
plot zf1 = f1;
plot zf2 = f2;
plot zf3 = f3;
plot zf4 = f4;
plot zf5 = f5;
zf1.SetDefaultColor(Color.gray);
zf2.SetDefaultColor(Color.orange);
zf3.SetDefaultColor(Color.magenta);
zf4.SetDefaultColor(Color.orange);
zf5.SetDefaultColor(Color.gray);
#