
shakib3585
Active member
Discrepancies of volume profile at different aggregations with the same "Time per Profile"
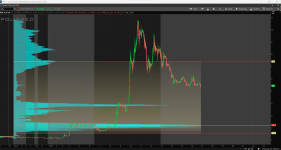
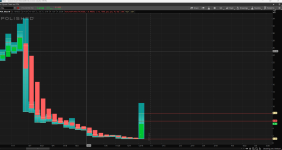
I am seeing a strange issue with the volume profile in TOS. I have selected the volume profile study and selected "Week" as "time per profile". I applied for the ticker "POL". When the aggregation is "5D: 1m", I see the VAH, VAL, and POC being 7.4, 1.55, and 2.19. With the same study on a "Max: W" aggregation, I see 8.14, 1.12, and 5.98, respectively. I have attached the two images for reference. Is there a reason for this discrepancy? If so, is there a way to solve it?
Thank you
Attachments
Last edited by a moderator: