
mbarcala
Active member
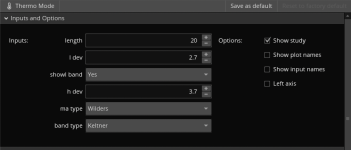
Here it's dBands or Double Bands Indicator. This It's a well known Bollinger Band and Keltner Channel indicators all in one place. I actually add a second double band inside that you can hide or not depend your need while you trading time and expertise. It's completely customizable for you to play in many ways.
Single Band
15662[/ATTACH]']

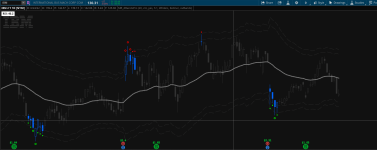
Double Band
15664[/ATTACH]']

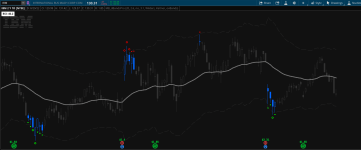
Price Crossing Mid Band
15666[/ATTACH]']

script:
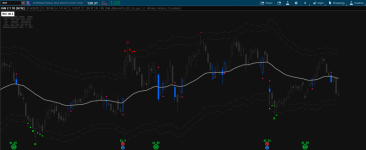
This is a very interesting setup:
15668[/ATTACH]']

Single Band
15662[/ATTACH]']
Double Band
15664[/ATTACH]']
Price Crossing Mid Band
15666[/ATTACH]']
script:
Code:
# Double Bands by mbarcala for thinkorswim

input length = 20;
input lDev = 2.0;
input showBand = yes;
input hDev = 2.6;
input maType = {default "Exponential", "Simple", "Wilders", "Weighted"};
input bandType = {default "Bollinger", "Keltner"};
input colorType = {default "CrossMa", "ovBands"};

def sDev = StDev(close, length);
def shift1 = lDev * ExpAverage(TrueRange(high, close, low), length);
def shift2 = hDev * ExpAverage(TrueRange(high, close, low), length);

plot midBand;
switch (maType) {
case "Exponential":
    midBand = ExpAverage(close, length);
case "Simple":
    midBand = SimpleMovingAvg(close, length);
case "Wilders":
    midBand = WildersAverage(close, length);
case "Weighted":
    midBand = WMA(close, length);
}

plot UpBand1;
plot DnBand1;
plot UpBand2;
plot DnBand2;
switch (bandType) {
case "Bollinger":
    UpBand1 = midBand + lDev * sDev;
    DnBand1 = midBand - lDev * sDev;
    UpBand2 = midBand + hDev * sDev;
    DnBand2 = midBand - hDev * sDev;
case "Keltner":
    UpBand1 = midBand + shift1;
    DnBand1 = midBand - shift1;
    UpBand2 = midBand + shift2;
    DnBand2 = midBand - shift2;
}

DefineGlobalColor("Blue", CreateColor(0, 101, 255));
DefineGlobalColor("dGray", CreateColor(50, 50, 50));
DefineGlobalColor("Burg", CreateColor(230, 17, 125));

midBand.SetDefaultColor(Color.GRAY);
midBand.SetLineWeight(3);
midBand.HideTitle();

UpBand1.SetDefaultColor(GlobalColor("dGray"));
UpBand1.SetStyle(Curve.LONG_DASH);
UpBand1.HideBubble();
UpBand1.HideTitle();
UpBand1.SetHiding(showBand);
UpBand2.SetDefaultColor(GlobalColor("dGray"));
UpBand2.SetStyle(Curve.LONG_DASH);
UpBand2.HideBubble();
UpBand2.HideTitle();


DnBand1.SetDefaultColor(GlobalColor("dGray"));
DnBand1.SetStyle(Curve.LONG_DASH);
DnBand1.HideBubble();
DnBand1.HideTitle();
DnBand1.SetHiding(showBand);
DnBand2.SetDefaultColor(GlobalColor("dGray"));
DnBand2.SetStyle(Curve.LONG_DASH);
DnBand2.HideBubble();
DnBand2.HideTitle();


def prange = high - low;
def phigh = high + prange * .2;
def plow = low - prange * .2;

#Bands2
plot obHighLow = if close > UpBand2 or high > UpBand2 then phigh else
                 if close < DnBand2 or low < DnBand2 then plow else Double.NaN;
obHighLow.SetStyle(Curve.POINTS);
obHighLow.SetDefaultColor(Color.BLACK);
obHighLow.SetLineWeight(1);
obHighLow.HideTitle();
obHighLow.HideBubble();

plot obHighLowbg = if close > UpBand2 or high > UpBand2 then phigh else
                   if close < DnBand2 or low < DnBand2 then plow else Double.NaN;
obHighLowbg.SetStyle(Curve.POINTS);
obHighLowbg.SetLineWeight(5);
obHighLowbg.AssignValueColor(if close > UpBand2 or high > UpBand2 then Color.RED else Color.GREEN);
obHighLowbg.HideTitle();
obHighLowbg.HideBubble();

def obpHLsq = if close > UpBand1 or high > UpBand1 then phigh else Double.NaN;
def obnHLsq = if close < DnBand1 or low < DnBand1 then plow else Double.NaN;

plot obsHigh = if obpHLsq then phigh else Double.NaN;
obsHigh.SetPaintingStrategy(PaintingStrategy.SQUARES);
obsHigh.SetLineWeight(1);
obsHigh.SetHiding(showBand);
obsHigh.SetDefaultColor(Color.RED);
obsHigh.HideTitle();
obsHigh.HideBubble();

plot obsLow = if obnHLsq then plow else Double.NaN;
obsLow.SetPaintingStrategy(PaintingStrategy.SQUARES);
obsLow.SetLineWeight(1);
obsLow.SetHiding(showBand);
obsLow.SetDefaultColor(Color.GREEN);
obsLow.HideTitle();
obsLow.HideBubble();

def dcUp = if close[1] crosses below midBand and close crosses above midBand or close crosses above midBand then 1 else 0;
def dcDn = if close[1] crosses above midBand and close crosses below midBand or close crosses below midBand then 1 else 0;

def ovUpBands = if close > UpBand1 or high > UpBand1 then 1 else 0;
def ovDnBands = if close < DnBand1 or low < DnBand1 then 1 else 0;

## Dots Direction ##
def viUpDn = if dcUp or dcDn then 1 else if viUpDn[1] == 1 and dcUp or dcDn then 1 else 0;

def debug = yes;
plot x = if !debug then Double.NaN else viUpDn;
x.Hide();

def UpView;
def DnView;
plot diDots;
def ovUpBand;
def ovDnBand;

switch (colorType) {
case "CrossMa":
    UpView = dcUp;
    DnView = dcDn;
    diDots = if UpView and viUpDn[-1] == 0 then plow else
             if DnView and viUpDn[-1] == 0 then phigh else Double.NaN;
    ovUpBand = Double.NaN;
    ovDnBand = Double.NaN;
case "ovBands":
    UpView = Double.NaN;
    DnView = Double.NaN;
    diDots = Double.NaN;
    ovUpBand = ovUpBands;
    ovDnBand = ovDnBands;
}

diDots.SetDefaultColor(GlobalColor("Burg"));
diDots.SetStyle(Curve.POINTS);
diDots.SetLineWeight(2);
diDots.HideTitle();
diDots.HideBubble();

AssignPriceColor(if colorType == colorType."CrossMa" then if UpView or DnView then GlobalColor("Blue") else GlobalColor("dGray") else
                 if colorType == colorType."ovBands" then if ovUpBand or ovDnBand then GlobalColor("Blue") else GlobalColor("dGray") else Color.CURRENT);

#UpperBand and LowerBand Labels
def cond1 = close > UpBand1 or close < UpBand2;
def cond2 = close < DnBand1 or close > DnBand2;
def cond3 = close > UpBand2;
def cond4 = close < DnBand2;
def cond5 = close < UpBand1 or close > DnBand1;

AddLabel(yes, if cond1 then " UpperBand: " + lDev + " " else
              if cond2 then " LowerBand: " + -lDev + " " else
              if cond3 then " UpperBand: " + hDev + " " else
              if cond4 then " LowerBand: " + -hDev + " " else
              if cond5 then " LevelBand: " + " N/A " else "",
              if cond1 then Color.DARK_RED else
              if cond3 then Color.RED else
              if cond2 then Color.DARK_GREEN else
              if cond4 then Color.GREEN else
              if cond5 then Color.GRAY else Color.CURRENT);
This is a very interesting setup:
15668[/ATTACH]']
Attachments
Last edited: