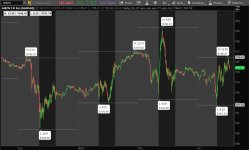
Daily high/low bubble that displays TIME

Solution
The only actual working example I could find is https://usethinkscript.com/threads/how-do-you-get-the-time-of-high-of-day.3751/post-97451

It works great BUT it only displays the most recent day. Is it possible for someone to edit this so that it works for EVERYDAY and include premarket hours? Premarket isn't really necessary but it would be nice to have the option.

Thanks

EDIT - 01c
fixed , lines plotting at 0 on some first few bars

----------------------
EDIT - 01b
fixed lines, bubbles at 0 and 99999 , after day close

----------------------

had to rewrite it to find highs and lows for every day
works with extended hours on or off

can show horizontal lines at the highs and lows

Code:
#daily_hilo_01c...
The only actual working example I could find is https://usethinkscript.com/threads/how-do-you-get-the-time-of-high-of-day.3751/post-97451

It works great BUT it only displays the most recent day. Is it possible for someone to edit this so that it works for EVERYDAY and include premarket hours? Premarket isn't really necessary but it would be nice to have the option.

Thanks
Have you tried the standard DailyHighLow study?

Its a very useful study to print high/low lines from prior day as inherent resistance levels.
 

Join useThinkScript to post your question to a community of 21,000+ developers and traders.

The only actual working example I could find is https://usethinkscript.com/threads/how-do-you-get-the-time-of-high-of-day.3751/post-97451

It works great BUT it only displays the most recent day. Is it possible for someone to edit this so that it works for EVERYDAY and include premarket hours? Premarket isn't really necessary but it would be nice to have the option.

Thanks

EDIT - 01c
fixed , lines plotting at 0 on some first few bars

----------------------
EDIT - 01b
fixed lines, bubbles at 0 and 99999 , after day close

----------------------

had to rewrite it to find highs and lows for every day
works with extended hours on or off

can show horizontal lines at the highs and lows

Code:
#daily_hilo_01c

#https://usethinkscript.com/threads/need-help-with-existing-script-daily-high-low-bubble-that-displays-time.20759/
#Need help with existing script - Daily high/low bubble that displays TIME
#====================
#https://usethinkscript.com/threads/how-do-you-get-the-time-of-high-of-day.3751/page-2#post-97451
#SleepyZ

def na = double.nan;
def bn = barnumber();

def day = getday();
def newday = day != day[1];
def big = 99999;
def n = 1000;

input show_label = yes;
input show_bubbles = yes;
input showprice_in_bubble = yes;
#Time zone
input timezone = {default "ET", "CT", "MT",  "PT"};

def starthour  = (if timezone == timezone."ET" then 9
   else if timezone == timezone."CT" then 8
   else if timezone == timezone."MT" then 7
   else 6);
def hour = Floor(((starthour * 60 + 30) + (GetTime() - RegularTradingStart(GetYYYYMMDD())) / 60000) / 60);
def minutes = (GetTime() - RegularTradingStart(GetYYYYMMDD())) / 60000 - ((hour - starthour) * 60 + 30) + 60;


def hi;
def lo;
def hibn;
def lobn;
if bn == 1 then {
 hi = 0;
 lo = 0;
 hibn = 0;
 lobn = 0;
} else if newday and !isnan(close) then {
hi = fold a = 0 to n
 with b
 while getvalue(day,-a) == day and !isnan(getvalue(close,-a))
 do max(b,getvalue(high,-a));

hibn = bn + (fold c = 0 to n
 with d
 while getvalue(day,-c) == day and getvalue(high,-c) != hi
 do d+1);

lo = fold e = 0 to n
 with f = big
 while getvalue(day,-e) == day and !isnan(getvalue(close,-e))
 do min(f,getvalue(low,-e));

lobn = bn + (fold g = 0 to n
 with h
 while getvalue(day,-g) == day and getvalue(low,-g) != lo
 do h+1);

} else {
hi = hi[1];
lo = lo[1];
hibn = hibn[1];
lobn = lobn[1];
}


addchartbubble(show_bubbles and bn == hibn, hi, 
 "H: "+ (hour + ":") +
 (if minutes < 10 then "0" + minutes else  "" + minutes) + "\n" +
 (if showprice_in_bubble then asdollars(high) else "")
, Color.WHITE
, yes);

addchartbubble(show_bubbles and bn == lobn, lo, 
 "L: "+ (hour + ":") +
 (if minutes < 10 then "0" + minutes else  "" + minutes) + "\n" +
 (if showprice_in_bubble then asdollars(low) else "")
, Color.WHITE
, no);

def lasthihr = if bn == hibn then hour else lasthihr[1];
def lasthimin = if bn == hibn then minutes else lasthimin[1]; 
def lastlohr = if bn == lobn then hour else lastlohr[1];
def lastlomin = if bn == lobn then minutes else lastlomin[1]; 


addlabel(1, " ", color.black);
AddLabel(show_label,
  "H: " + (lasthihr + ":") +
  (if lasthimin < 10 then "0" + lasthimin else  "" + lasthimin) +  " | " +
  Asdollars(hi), Color.WHITE);
addlabel(1, " ", color.black);

AddLabel(show_label,
  "L: " + (lastlohr + ":") +
  (if lastlomin < 10 then "0" + lastlomin else  "" + lastlomin) +  " | " +
  Asdollars(lo), Color.WHITE);
addlabel(1, " ", color.black);

input show_hilo_lines = yes;
plot zhi = if show_hilo_lines and !isnan(close) and hi > 0 then hi else na;
zhi.SetPaintingStrategy(PaintingStrategy.HORIZONTAL);
zhi.SetDefaultColor(Color.light_gray);
zhi.setlineweight(1);
#zhi.hidebubble();

plot zlo = if show_hilo_lines and !isnan(close) and lo > 0 then lo else na;
zlo.SetPaintingStrategy(PaintingStrategy.HORIZONTAL);
zlo.SetDefaultColor(Color.light_gray);
zlo.setlineweight(1);
#zlo.hidebubble();

#---------------------------
input test_vlines = no;
addverticalline(test_vlines and bn == hibn,"-", color.green);
addverticalline(test_vlines and bn == lobn,"-", color.red);

addchartbubble(0 and newday, low,
hi + "\n" +
lo + "\n" +
hibn + "\n" +
lobn + "\n" 
, color.yellow, no);
#
 

Attachments

  • img1 amzn.JPG
    img1 amzn.JPG
    118.4 KB · Views: 61
Last edited:
Solution
had to rewrite it to find highs and lows for every day
works with extended hours on or off

can show horizontal lines at the highs and lows

Code:
#daily_hilo_01

#https://usethinkscript.com/threads/need-help-with-existing-script-daily-high-low-bubble-that-displays-time.20759/
#Need help with existing script - Daily high/low bubble that displays TIME
#====================
#https://usethinkscript.com/threads/how-do-you-get-the-time-of-high-of-day.3751/page-2#post-97451
#SleepyZ

def na = double.nan;
def bn = barnumber();

def day = getday();
def newday = day != day[1];
def big = 99999;
def n = 1000;

input show_label = yes;
input show_bubbles = yes;
input showprice_in_bubble = yes;
#Time zone
input timezone = {default "ET", "CT", "MT",  "PT"};

def starthour  = (if timezone == timezone."ET" then 9
   else if timezone == timezone."CT" then 8
   else if timezone == timezone."MT" then 7
   else 6);
def hour = Floor(((starthour * 60 + 30) + (GetTime() - RegularTradingStart(GetYYYYMMDD())) / 60000) / 60);
def minutes = (GetTime() - RegularTradingStart(GetYYYYMMDD())) / 60000 - ((hour - starthour) * 60 + 30) + 60;


def hi;
def lo;
def hibn;
def lobn;
if newday then {
hi = fold a = 0 to n
 with b
 while getvalue(day,-a) == day and !isnan(getvalue(close,-a))
 do max(b,getvalue(high,-a));

hibn = bn + (fold c = 0 to n
 with d
 while getvalue(day,-c) == day and getvalue(high,-c) != hi
 do d+1);

lo = fold e = 0 to n
 with f = big
 while getvalue(day,-e) == day and !isnan(getvalue(close,-e))
 do min(f,getvalue(low,-e));

lobn = bn + (fold g = 0 to n
 with h
 while getvalue(day,-g) == day and getvalue(low,-g) != lo
 do h+1);

} else {
hi = hi[1];
lo = lo[1];
hibn = hibn[1];
lobn = lobn[1];
}


addchartbubble(show_bubbles and bn == hibn, hi,
 "H: "+ (hour + ":") +
 (if minutes < 10 then "0" + minutes else  "" + minutes) + "\n" +
 (if showprice_in_bubble then asdollars(high) else "")
, Color.WHITE
, yes);

addchartbubble(show_bubbles and bn == lobn, lo,
 "L: "+ (hour + ":") +
 (if minutes < 10 then "0" + minutes else  "" + minutes) + "\n" +
 (if showprice_in_bubble then asdollars(low) else "")
, Color.WHITE
, no);

def lasthihr = if bn == hibn then hour else lasthihr[1];
def lasthimin = if bn == hibn then minutes else lasthimin[1];
def lastlohr = if bn == lobn then hour else lastlohr[1];
def lastlomin = if bn == lobn then minutes else lastlomin[1];


addlabel(1, " ", color.black);
AddLabel(show_label,
  "H: " + (lasthihr + ":") +
  (if lasthimin < 10 then "0" + lasthimin else  "" + lasthimin) +  " | " +
  Asdollars(hi), Color.WHITE);
addlabel(1, " ", color.black);

AddLabel(show_label,
  "L: " + (lastlohr + ":") +
  (if lastlomin < 10 then "0" + lastlomin else  "" + lastlomin) +  " | " +
  Asdollars(lo), Color.WHITE);
addlabel(1, " ", color.black);

input show_hilo_lines = yes;
plot zhi = if show_hilo_lines then hi else na;
zhi.SetPaintingStrategy(PaintingStrategy.HORIZONTAL);
zhi.SetDefaultColor(Color.light_gray);
zhi.setlineweight(1);
#zhi.hidebubble();

plot zlo = if show_hilo_lines then lo else na;
zlo.SetPaintingStrategy(PaintingStrategy.HORIZONTAL);
zlo.SetDefaultColor(Color.light_gray);
zlo.setlineweight(1);
#zlo.hidebubble();

#---------------------------
input test_vlines = no;
addverticalline(test_vlines and bn == hibn,"-", color.green);
addverticalline(test_vlines and bn == lobn,"-", color.red);

addchartbubble(0 and newday, low,
hi + "\n" +
lo + "\n" +
hibn + "\n" +
lobn + "\n"
, color.yellow, no);
#
Thank you very much you're are THE MAN or WOMAN!!! I feel like Ice Cube, today was a good day.

Looks perfect with one minor hiccup which isn't the end of the world if it can't be fixed, It's putting out a high/low bubble for SUNDAY.

Any way to get rid of that one hiccup? I don't care if Sunday high/low aren't factored into Friday or Monday's high/low.

Thanks again.
 
Last edited:
Thank you very much you're are THE MAN or WOMAN!!! I feel like Ice Cube, today was a good day.

Looks perfect with one minor hiccup which isn't the end of the world if it can't be fixed, It's putting out a high/low bubble for SUNDAY.

Any way to get rid of that one hiccup? I don't care if Sunday high/low aren't factored into Friday or Monday's high/low.

Thanks again.
(old guy) heh

missed that (sunday) . will look

will have to wait a little bit, my assistant wants to have a meeting
 

Attachments

  • 20250321_153941.jpg
    20250321_153941.jpg
    692.5 KB · Views: 20
Last edited:
fixed code in post #4

It's still showing sunday high low, from the few weekends I looked at so far from at least Sunday 6pm until Monday 1am.

And oddly it's showing just 600 for Sunday instead of 1800, also some oddities with the Low time as well.

Good looking cat you got there. Here's my scalping partner.
 

Attachments

  • PXL_20250321_211109217.jpg
    PXL_20250321_211109217.jpg
    436.3 KB · Views: 21
Last edited:
It's still showing sunday high low, from the few weekends I looked at so far from at least Sunday 6pm until Monday 1am.

And oddly it's showing just 600 for Sunday instead of 1800, also some oddities with the Low time as well.

Good looking cat you got there. Here's my scalping partner.

updated post #4 again.
i fixed one thing. it was plotting lines at 0 sometimes on the first few bars.

i don't understand what you are seeing.
are you looking at futures? you didn't mention that before.
if you are, then it would have to be completely rewritten...
 
updated post #4 again.
i fixed one thing. it was plotting lines at 0 sometimes on the first few bars.

i don't understand what you are seeing.
are you looking at futures? you didn't mention that before.
if you are, then it would have to be completely rewritten...

That's a drag that it would need to be rewritten, if that takes a lot of work.

Ya, I only look at futures.
 

Similar threads

Not the exact question you're looking for?

Start a new thread and receive assistance from our community.

87k+ Posts
289 Online
Create Post

Similar threads

Similar threads

The Market Trading Game Changer

Join 2,500+ subscribers inside the useThinkScript VIP Membership Club
  • Exclusive indicators
  • Proven strategies & setups
  • Private Discord community
  • ‘Buy The Dip’ signal alerts
  • Exclusive members-only content
  • Add-ons and resources
  • 1 full year of unlimited support

Frequently Asked Questions

What is useThinkScript?

useThinkScript is the #1 community of stock market investors using indicators and other tools to power their trading strategies. Traders of all skill levels use our forums to learn about scripting and indicators, help each other, and discover new ways to gain an edge in the markets.

How do I get started?

We get it. Our forum can be intimidating, if not overwhelming. With thousands of topics, tens of thousands of posts, our community has created an incredibly deep knowledge base for stock traders. No one can ever exhaust every resource provided on our site.

If you are new, or just looking for guidance, here are some helpful links to get you started.

What are the benefits of VIP Membership?
VIP members get exclusive access to these proven and tested premium indicators: Buy the Dip, Advanced Market Moves 2.0, Take Profit, and Volatility Trading Range. In addition, VIP members get access to over 50 VIP-only custom indicators, add-ons, and strategies, private VIP-only forums, private Discord channel to discuss trades and strategies in real-time, customer support, trade alerts, and much more. Learn all about VIP membership here.
How can I access the premium indicators?
To access the premium indicators, which are plug and play ready, sign up for VIP membership here.
Back
Top